Turn on the layer. Read the ground.
Each layer scores the whole state every day, so you can screen WA at a glance and drill into a single tenement when something stands out.
Tenement Timeline
Play WA tenure changes forward and back over time, and watch grants, transfers and surrenders unfold across the state.
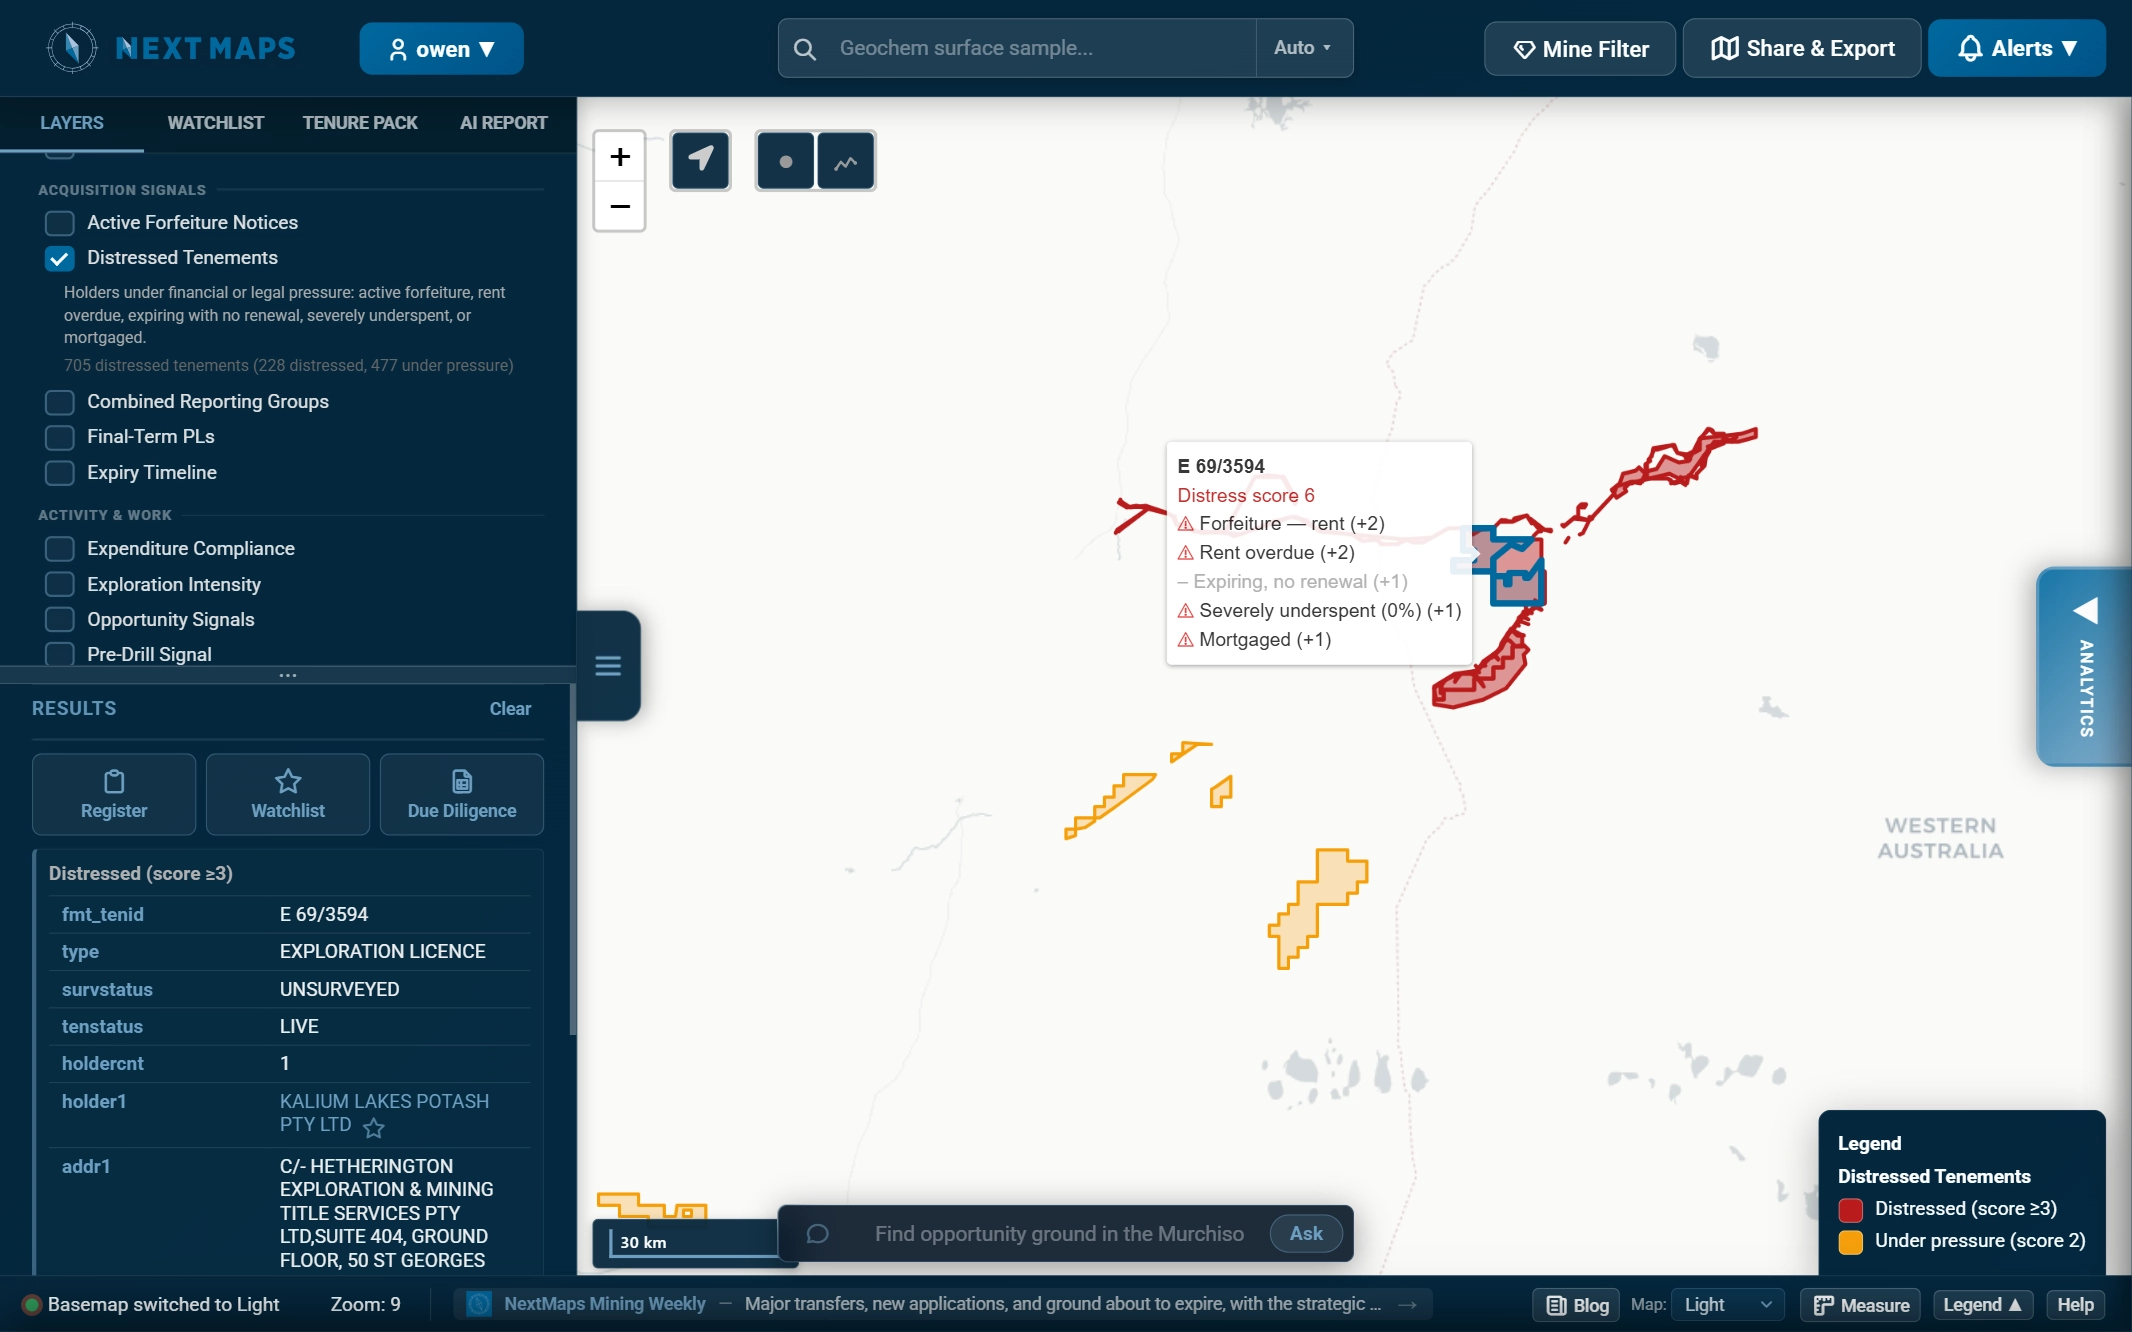
Distressed Tenements
Holders under financial or legal pressure: forfeiture, overdue rent, severe underspend, expiring with no renewal.
Ground Release Zones
Where supply is opening up, ground lapsing or being surrendered, before it is formally gazetted.
Expenditure Compliance
Actual spend versus the minimum obligation, so you can see who is underspending their commitment.
Application Hotspots
Where ground is being contested, grid cells coloured by how many companies are competing.
Expiry Timeline
Every live tenement coloured by time to expiry, with the final-term PL licences that cannot renew.
- Forfeiture, expenditure +3
- Rent overdue +2
- Expiring, no renewal +1
- Severely underspent (8%) +1
- Mortgaged +1
- Underspent (31% compliance) +1
- Low intensity (bottom 25% of type) +1
- Long-held (since Mar 2014) +1
- Rent lapsing, holder disengaged +1
Plus Recently Transferred, Ownership Age, Encumbered (mortgages and caveats), Forfeiture Notices, Conversion Pipeline, Pre-Drill Signal, Combined Reporting Groups, Exploration Intensity and an analytics dashboard.