Remote sensing and alteration

See the alteration, not just the dirt.

Spectral mineral mapping built into the WA tenement map. Work out where the alteration is without downloading imagery, loading it into QGIS, and writing the band ratios yourself. Regional ASTER to narrow the search, dated Sentinel-2 to zoom in and keep an eye on activity.

ASTER mineral maps

District-scale alteration, statewide.

The CSIRO and Geoscience Australia ASTER Geoscience products, served straight onto the map: the regional view that tells you which ground is worth a second look.

  • Iron oxides and gossan, AlOH clays, MgOH and silica.
  • Fourteen mineral-group products, each with its own opacity, so you can fade them in under your tenure and geology.
  • Pre-processed and ready, no download, no reprojection, no band math.
An ASTER mineral map shown over WA tenure in NextMaps
Timestamped Sentinel-2

Cloud-free and current, over your ground.

Once you have narrowed it down, set an "as of" date and a look-back window and NextMaps builds a fresh 10 m cloud-free Sentinel-2 mosaic over the exact block you are working.

  • Set an "as of" date, a look-back window (14 days to a year) and a cloud limit; the date of the latest clear pass is shown, so you always know how fresh the mosaic is.
  • Mineral-ratio composites for gossan, ferric iron and clay alteration, alongside true colour, SWIR and geology views.
  • Near-live monitoring: with a short look-back window and recent dates you can often pick out fresh drill lines, clearing and tracks on the ground around you.
A timestamped Sentinel-2 mineral-ratio composite shown over WA tenure in NextMaps
Why it matters

The signal is in the rock. You just have to see it.

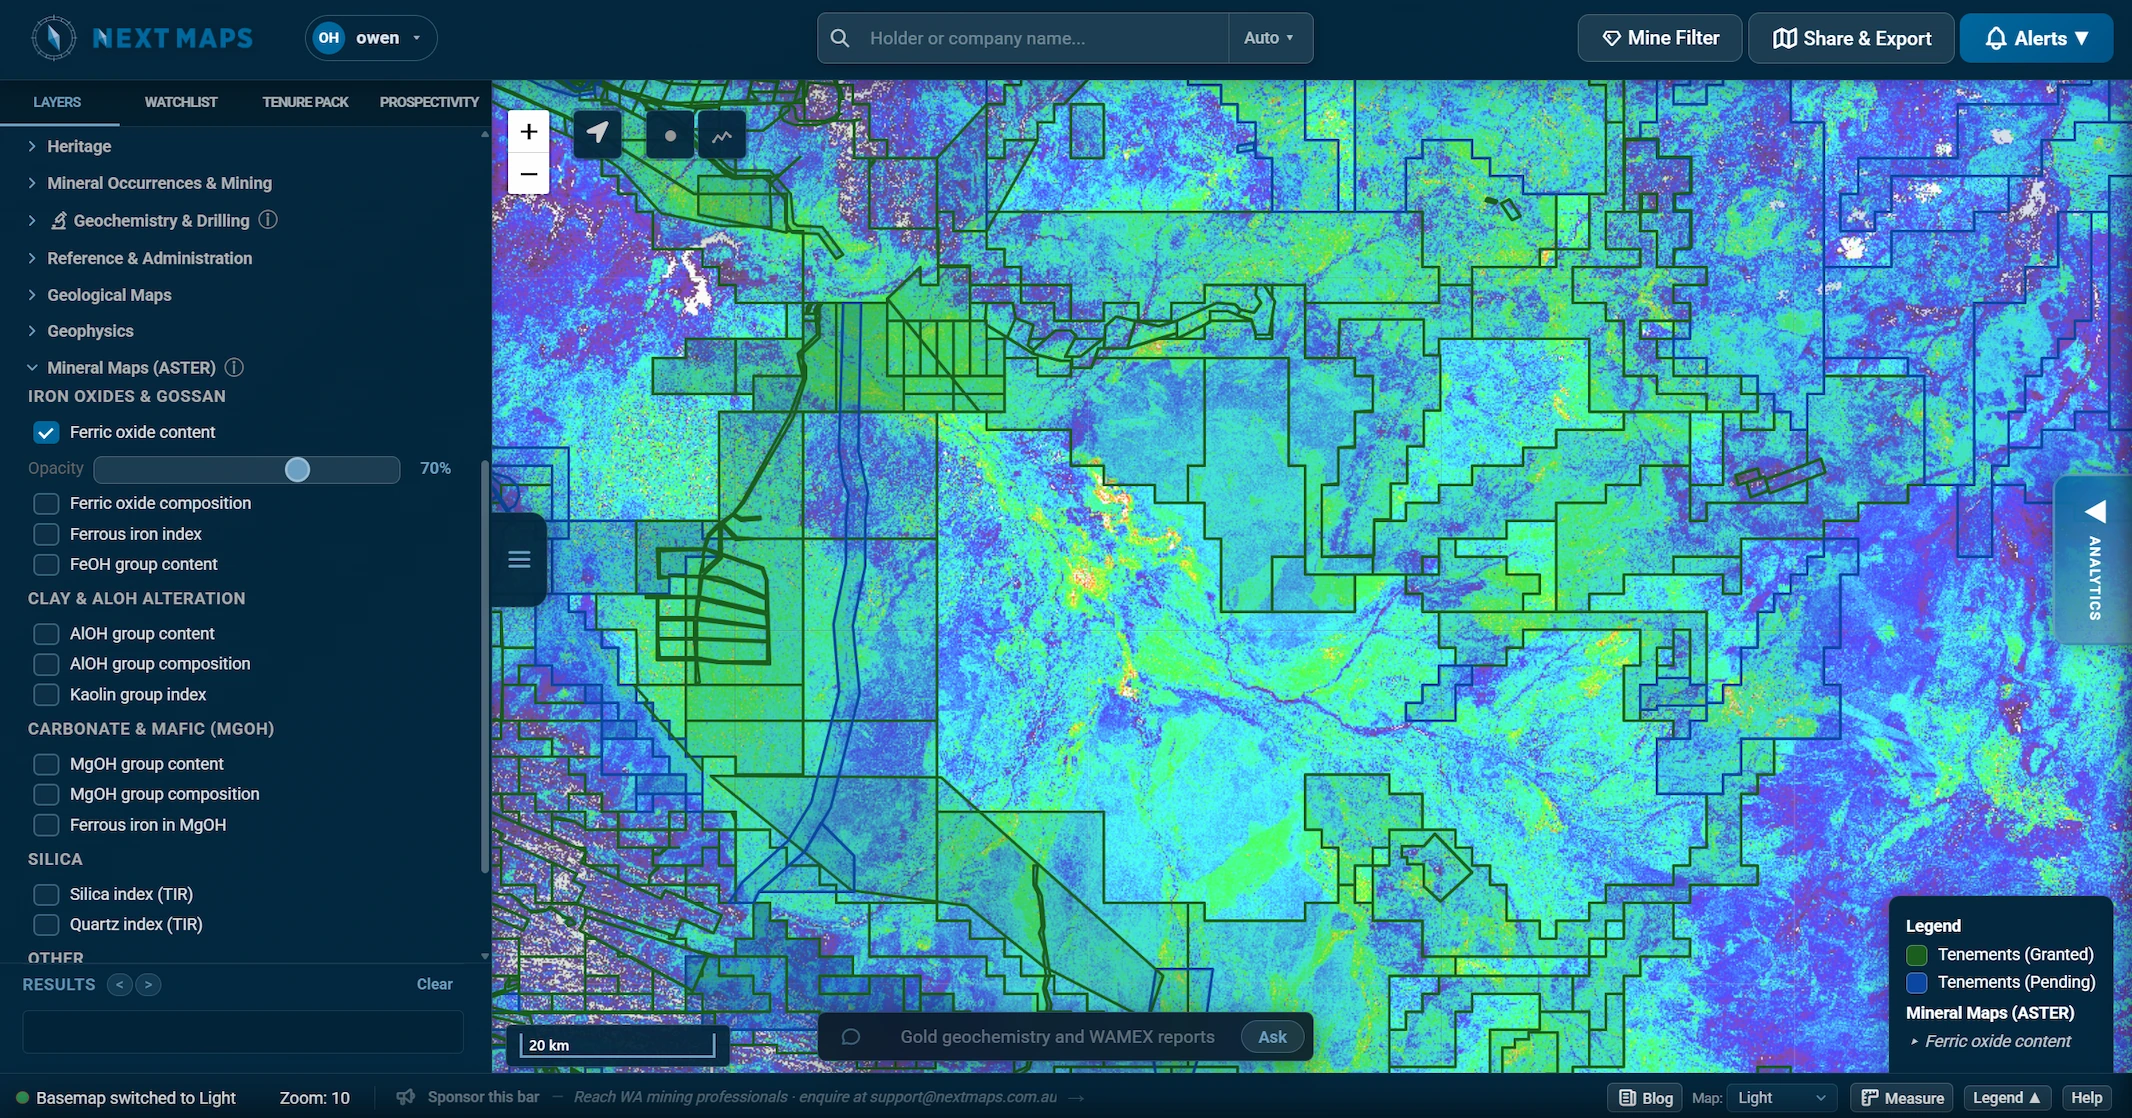
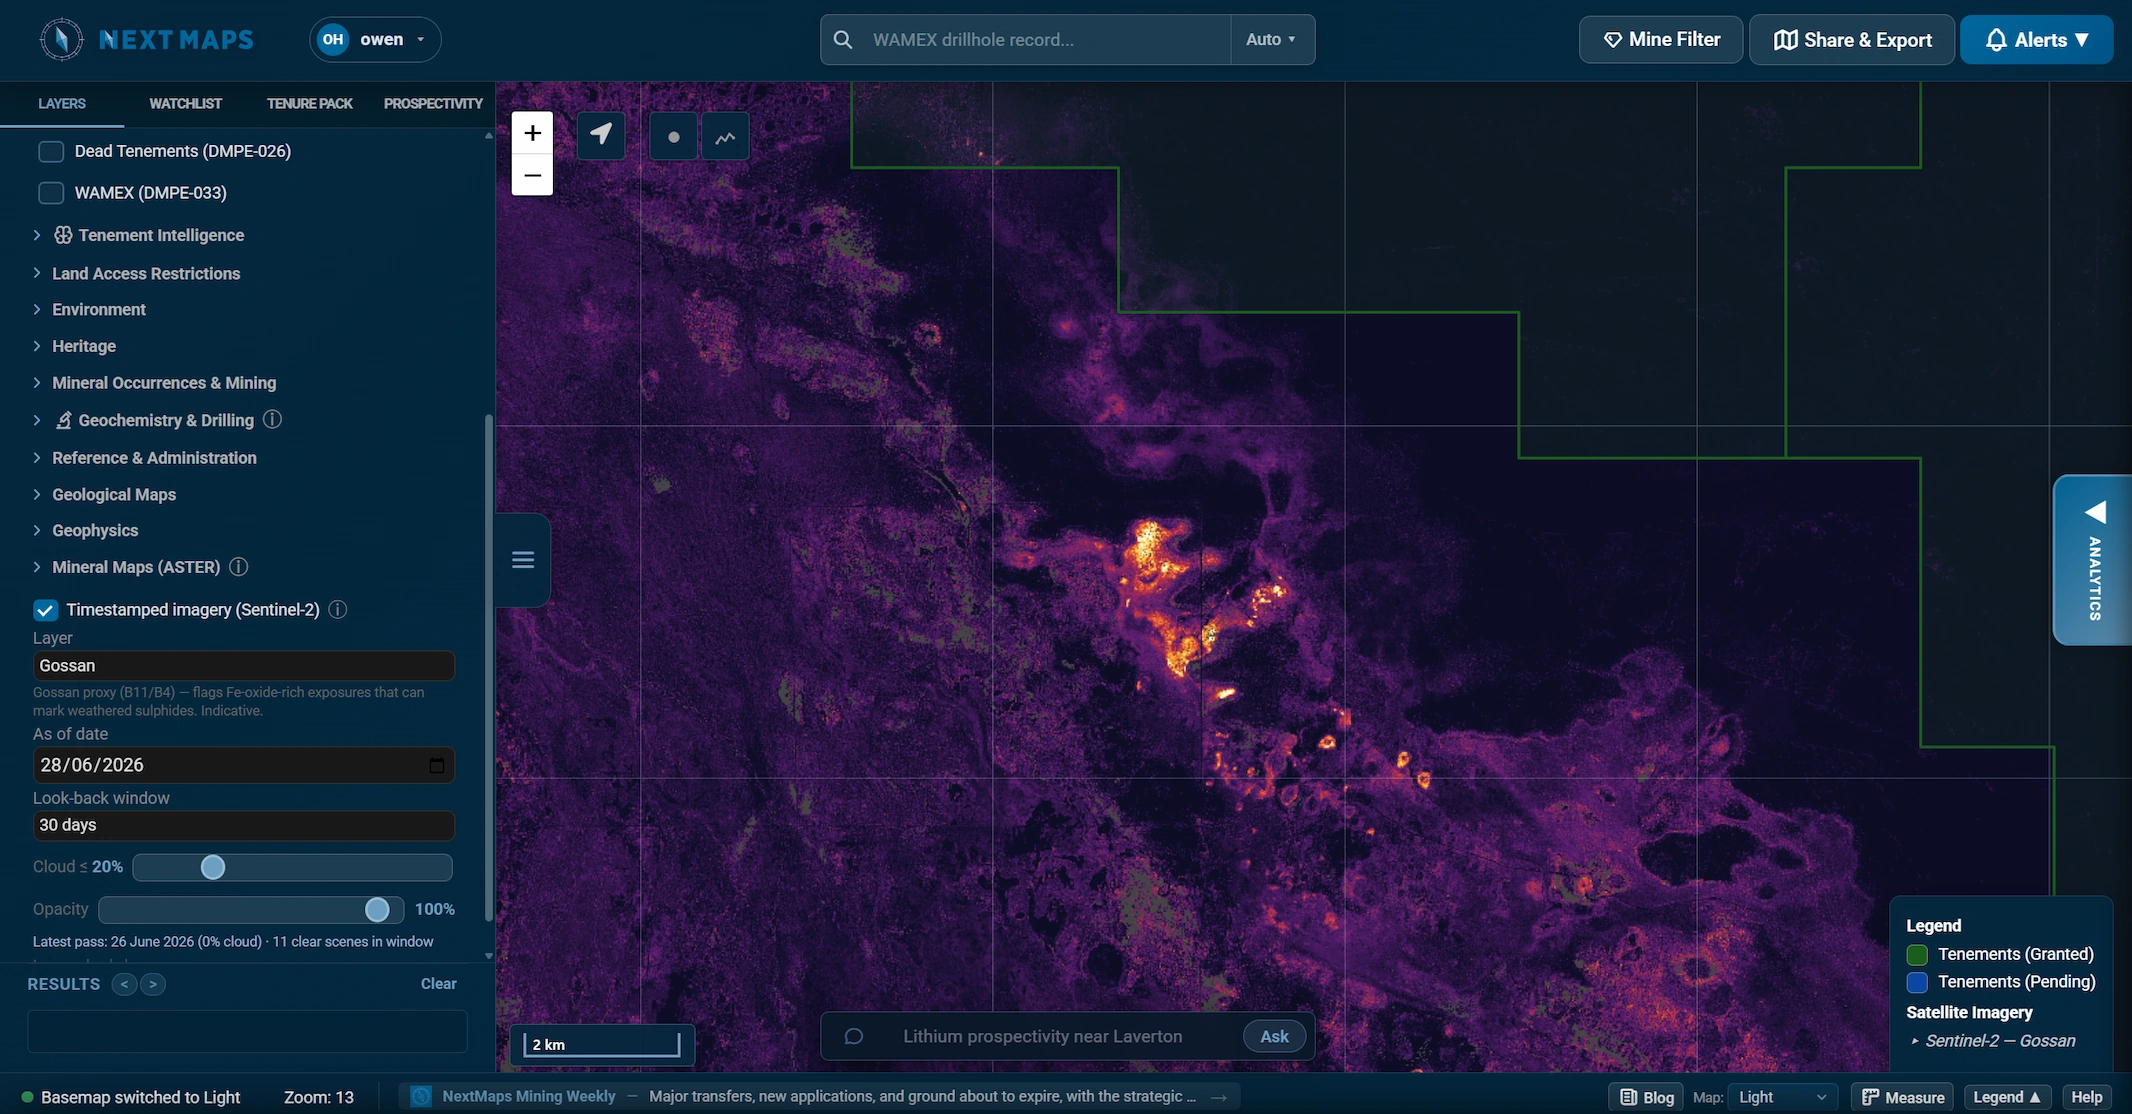
Alteration haloes, iron staining and clay caps are some of the clearest vectors toward mineralisation, and the spectral data to map them is public. The catch has always been the workflow: finding the right scenes, downloading gigabytes of imagery, loading it into a GIS, and writing the band-ratio expressions before you can even look. NextMaps does that work for you and puts the result on the same map as your tenure, geology and Tenement Intelligence.

These layers are pathfinders, not truth. A gossan ratio flags an iron-oxide spectral response, not a confirmed gossan, and vegetation and water are masked so they cannot masquerade as signal. Used the way a geologist actually works, regional ASTER to narrow the search and dated Sentinel-2 to zoom in, they point you at the ground worth a closer look, then a Prospectivity Data Room reads the WAMEX history behind it.

Credit where it is due: Grant Boxer's excellent QGIS resource (grantboxer.github.io/QGIS.html) first introduced us to these ASTER and Sentinel-2 band-ratio methods. All we have done is bring them into NextMaps so you can run them in a couple of clicks instead of building the workflow yourself.

See what your ground is telling you.