
18 new layers on the WA map: No-Go Zones, Hallberg's maps and more
Eighteen new layers on the NextMaps map of WA: No-Go Zones for the check before pegging, all 353 of Jack Hallberg's geological maps drawn on the map, GSWA's field notes, WMC's soils and lags, CSIRO groundwater chemistry and about 240 mills. Plus statewide magnetics from GSWA's 20 m merge.
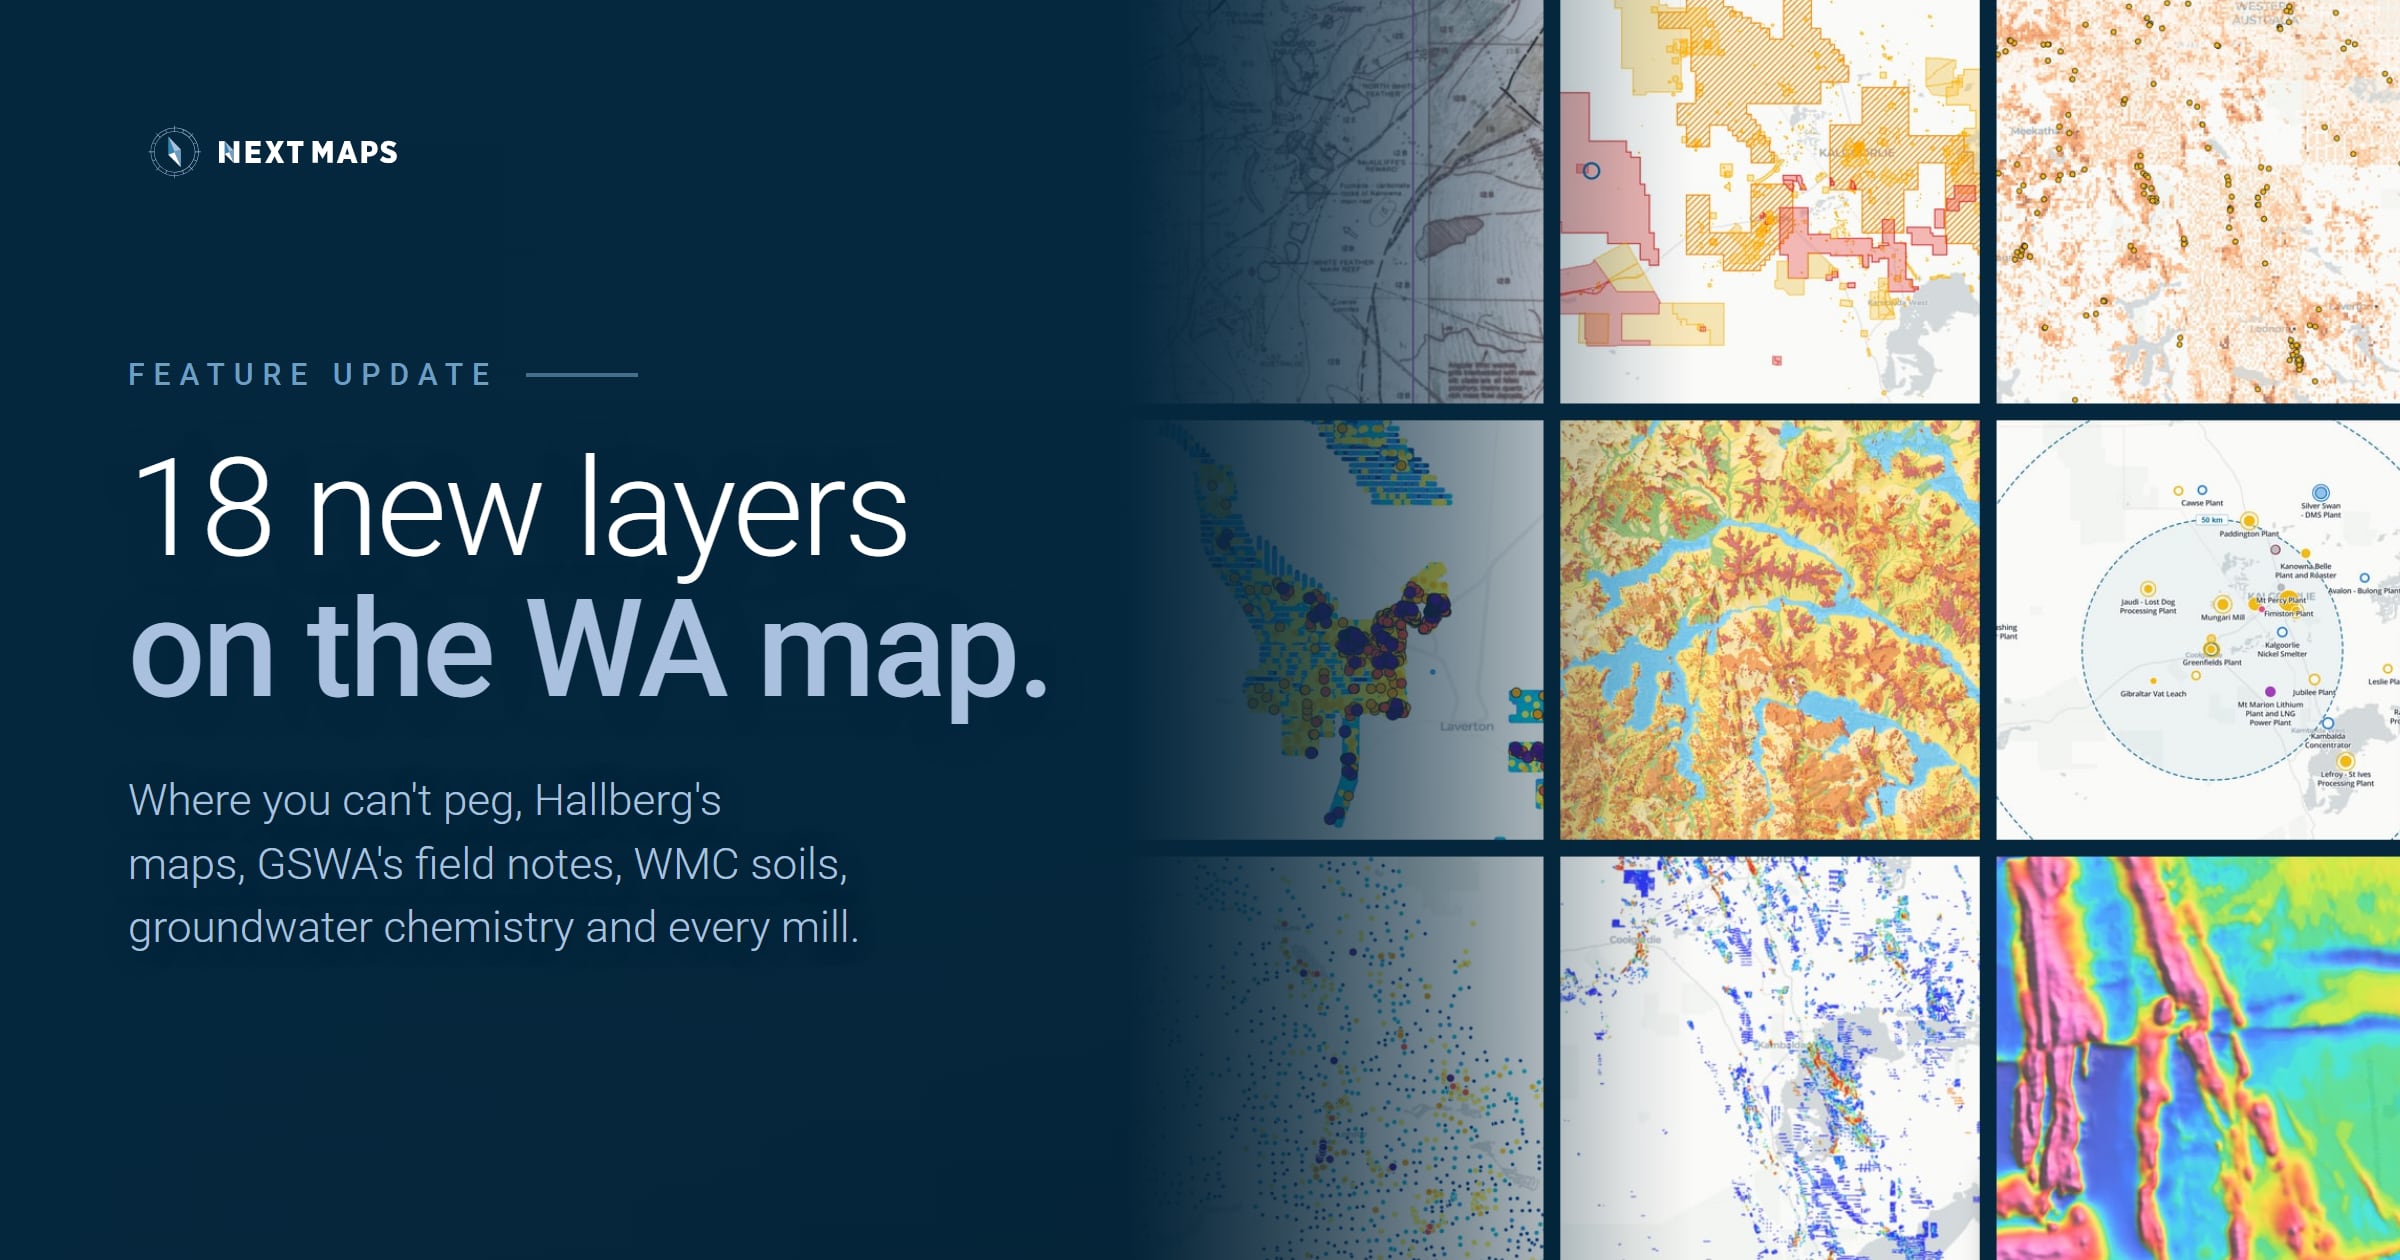
In the last two weeks, 18 new layers went onto the NextMaps map of Western Australia, and some of the layers already there got sharper. The headline six: a check of where you can't peg, Jack Hallberg's geological maps drawn on the map, GSWA's field notes, Western Mining's soils and lags, CSIRO's groundwater chemistry, and every mill in the state.
No-Go Zones: the check before pegging
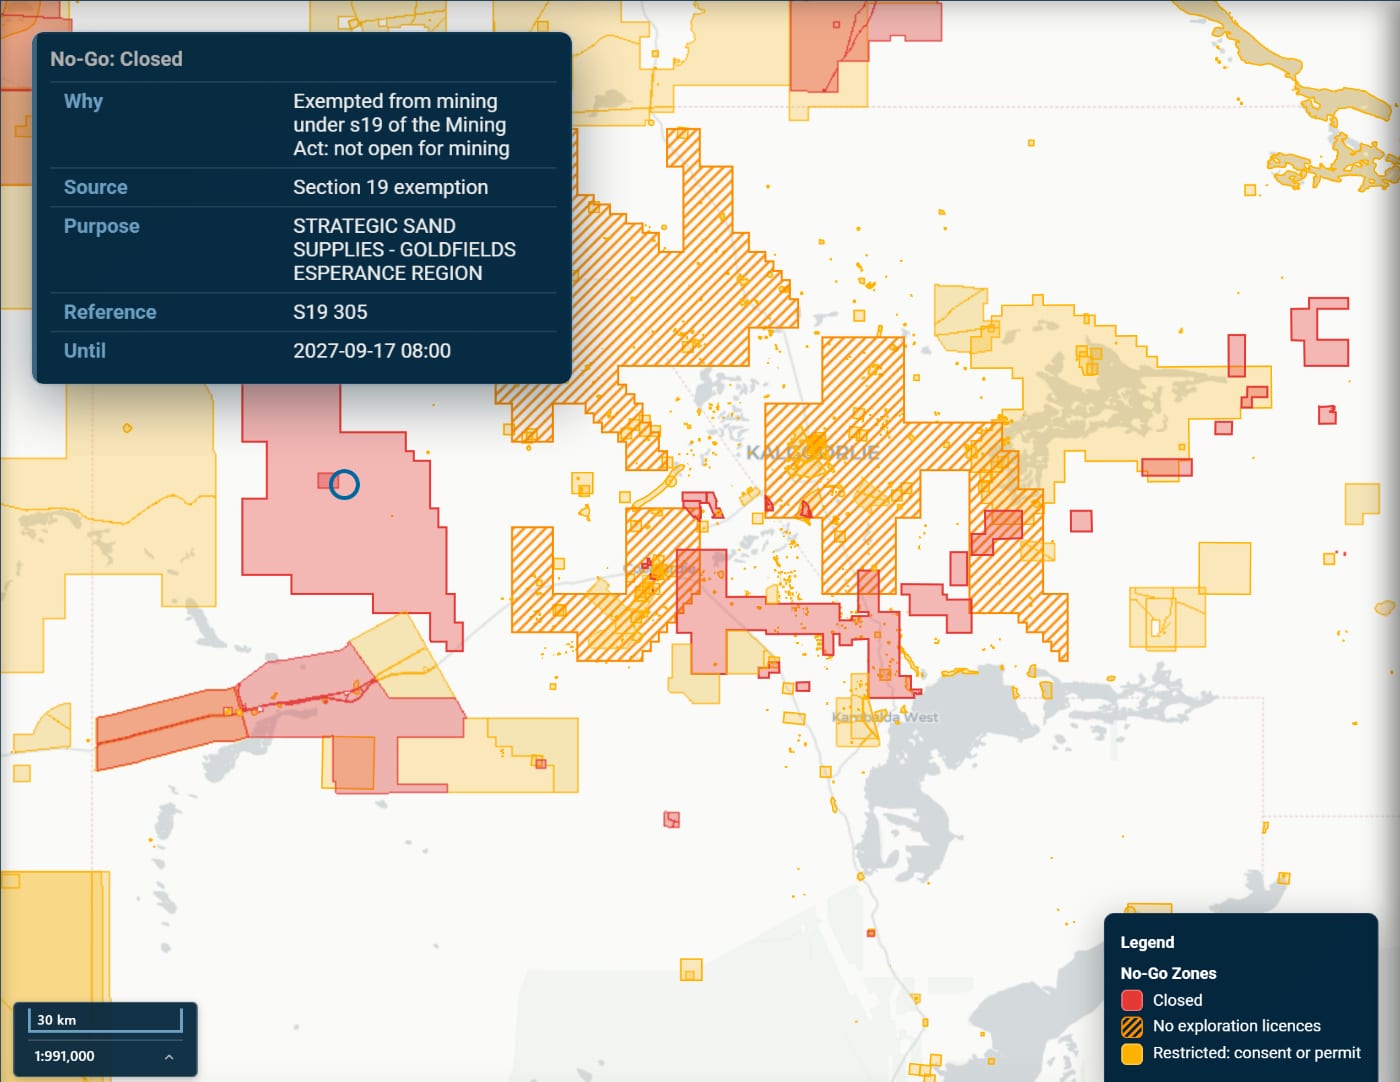
Whether ground can be pegged depends on datasets from half a dozen agencies: section 19 exemptions, section 57(4) areas, reserves, heritage, townsites and water. No-Go Zones, at the top of Land Access Restrictions, puts them into one layer in three colours:
- Red, closed: the ground can't be pegged, or can be pegged but never worked. Section 19 exemptions; national parks, class A reserves and marine parks; Aboriginal heritage protected areas; Exempt East Locations; Commonwealth defence training areas and mining exclusion zones.
- Orange hatch, no exploration licences: the section 57(4) areas around 12 intensely mined centres. Prospecting licences and mining leases can still be applied for.
- Amber, restricted: consent, a permit or a referral is needed before work. Other DBCA land such as State forest and conservation parks, proposed conservation lands, townsites, Aboriginal heritage places on the Register or lodged, listed threatened ecological communities, Priority 1 and 2 drinking water areas, and environmentally sensitive areas.
Click inside a coloured area and Results lists every constraint under the point and why it applies. West of Kalgoorlie, below, the red block is a section 19 exemption for strategic sand supplies, in force until September 2027.
National parks and class A reserves count as closed. An exploration licence can take one in, but a mining lease over it needs both Houses of Parliament, and no live title records a consent to explore one. The layer leaves out tenure (turn on Tenements for ground already held), native title, which sets the grant process rather than barring an application, and private land.
Seven of the sources are also new layers of their own: E licence size zones (where an exploration licence is capped at 70 blocks), DMPE's file notation areas, Landgate townsites, DBCA's proposed conservation lands, DWER's environmentally sensitive areas and drinking water source areas, and DPLH's Aboriginal heritage protected areas. The same check now runs in every Tenure Pack, which reports how much of a title or area is closed, closed to exploration licences or restricted, and why.
Jack Hallberg's maps, on the map
Jack Hallberg mapped the Yilgarn greenstone belts in detail: 1:25,000 sheets around Kalgoorlie, the Murchison, the north-eastern goldfields and the Northeast Yilgarn, and 1:50,000 sheets around Leonora and Laverton. Prospectors still work from them. DMPE publishes them as scanned PDFs, so putting one under your tenements has meant downloading it and georeferencing it yourself.
All 353 sheets are now georeferenced, and from zoom level 10 they are drawn on the map, with the paper made transparent so the imagery shows through. This is Kanowna, with the Q.E.D., Last Chance, Golden Crown and Ballarat leads and the White Feather main reef on the sheet, and Jack's red pen marking the Kanowna Belle prospect on DMPE's scan.
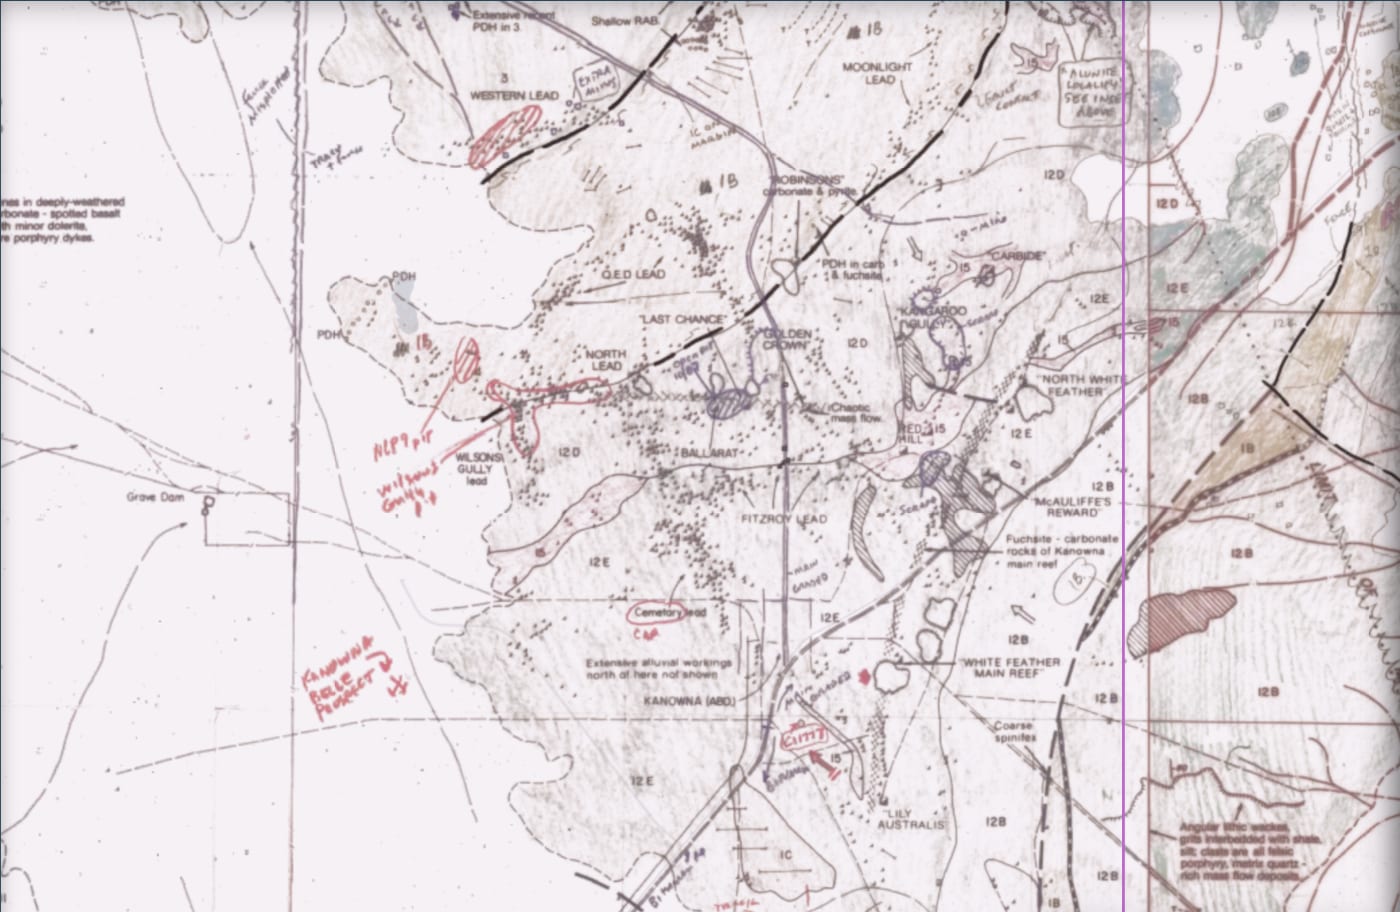
Click inside a sheet for its name, map code and links to DMPE's scans: the PDF and, for most 1:25,000 sheets, a black-and-white TIF.
GSWA's field notes
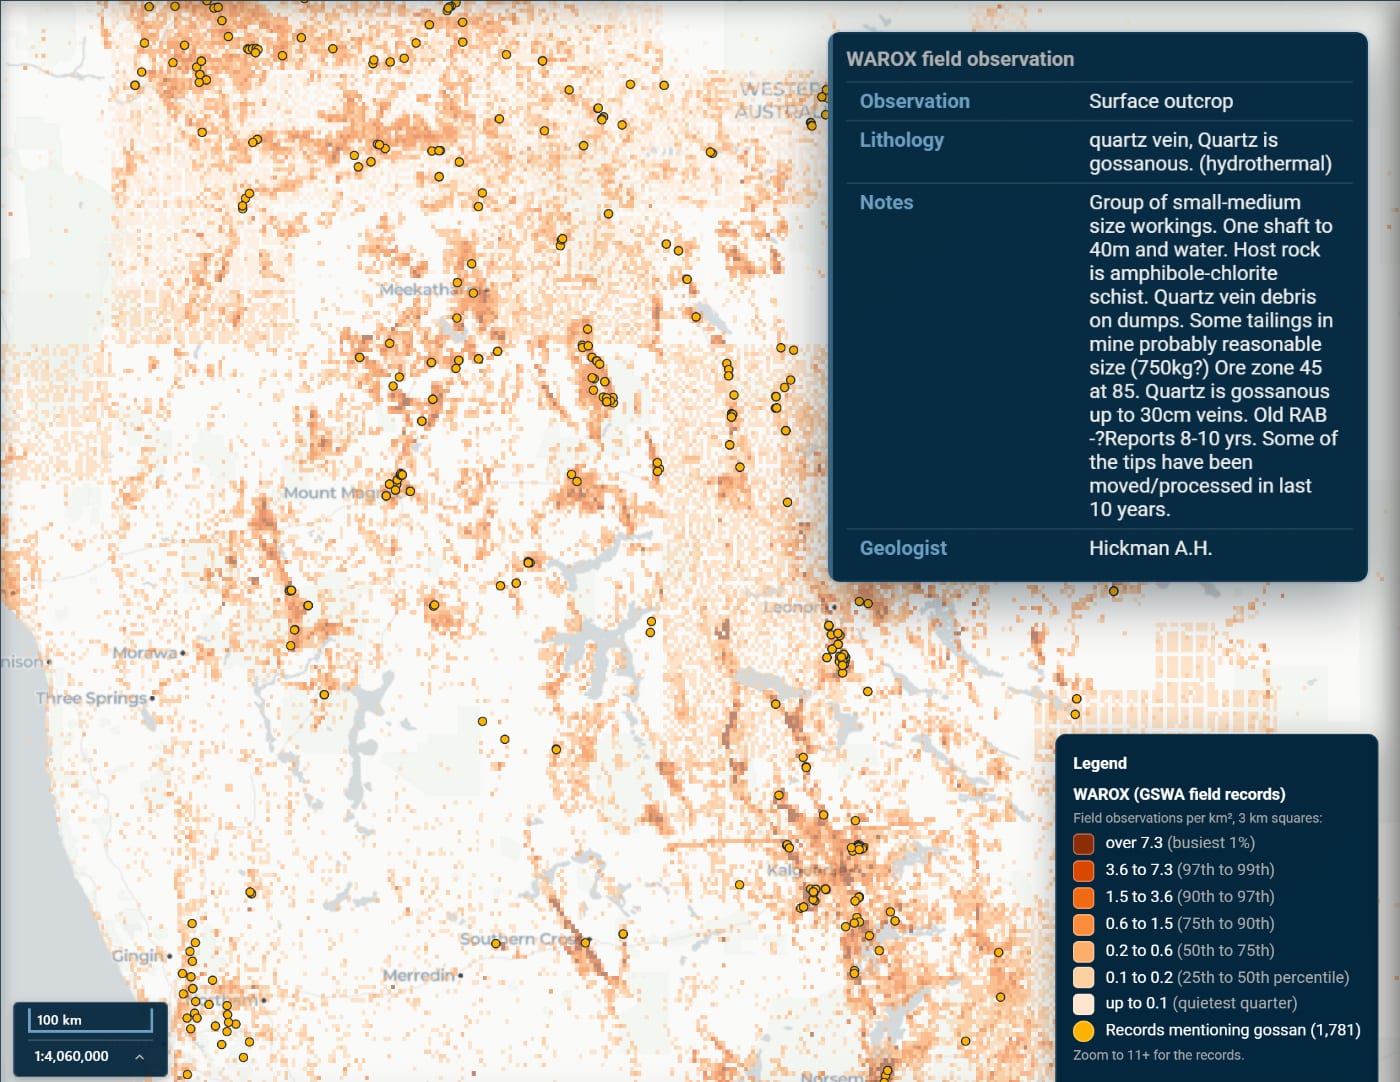
WAROX is GSWA's database of field observations: 466,751 records of outcrop, regolith, drillholes and notes, 152,489 of them rock samples. GSWA Field Observations (WAROX) puts all of them on the map. Zoomed out, orange squares show where the observations are densest. From zoom level 11 the records themselves are drawn: red for outcrop, tan for regolith, black for drillholes and grey for notes, with white rings for rock samples. Click one for the geologist's notes, lithology and year and, where GSWA analysed the sample, its assays.
Find in the field notes keeps only the records that mention a word. Twelve listed terms search the whole state at once, among them gossan, pegmatite, lithium minerals, banded iron formation, quartz veins, sulphides, copper minerals, komatiite and old workings. Below are the 1,781 records that mention gossan, and one of them: "Group of small-medium size workings. One shaft to 40m and water... Quartz is gossanous up to 30cm veins." Any other word searches from zoom level 11, and Rock samples narrows the samples to one rock family, such as ultramafic or felsic.
GSWA sample numbers and WAROX site IDs now work in the search bar, and take you straight to the record.
Western Mining's soils and lags
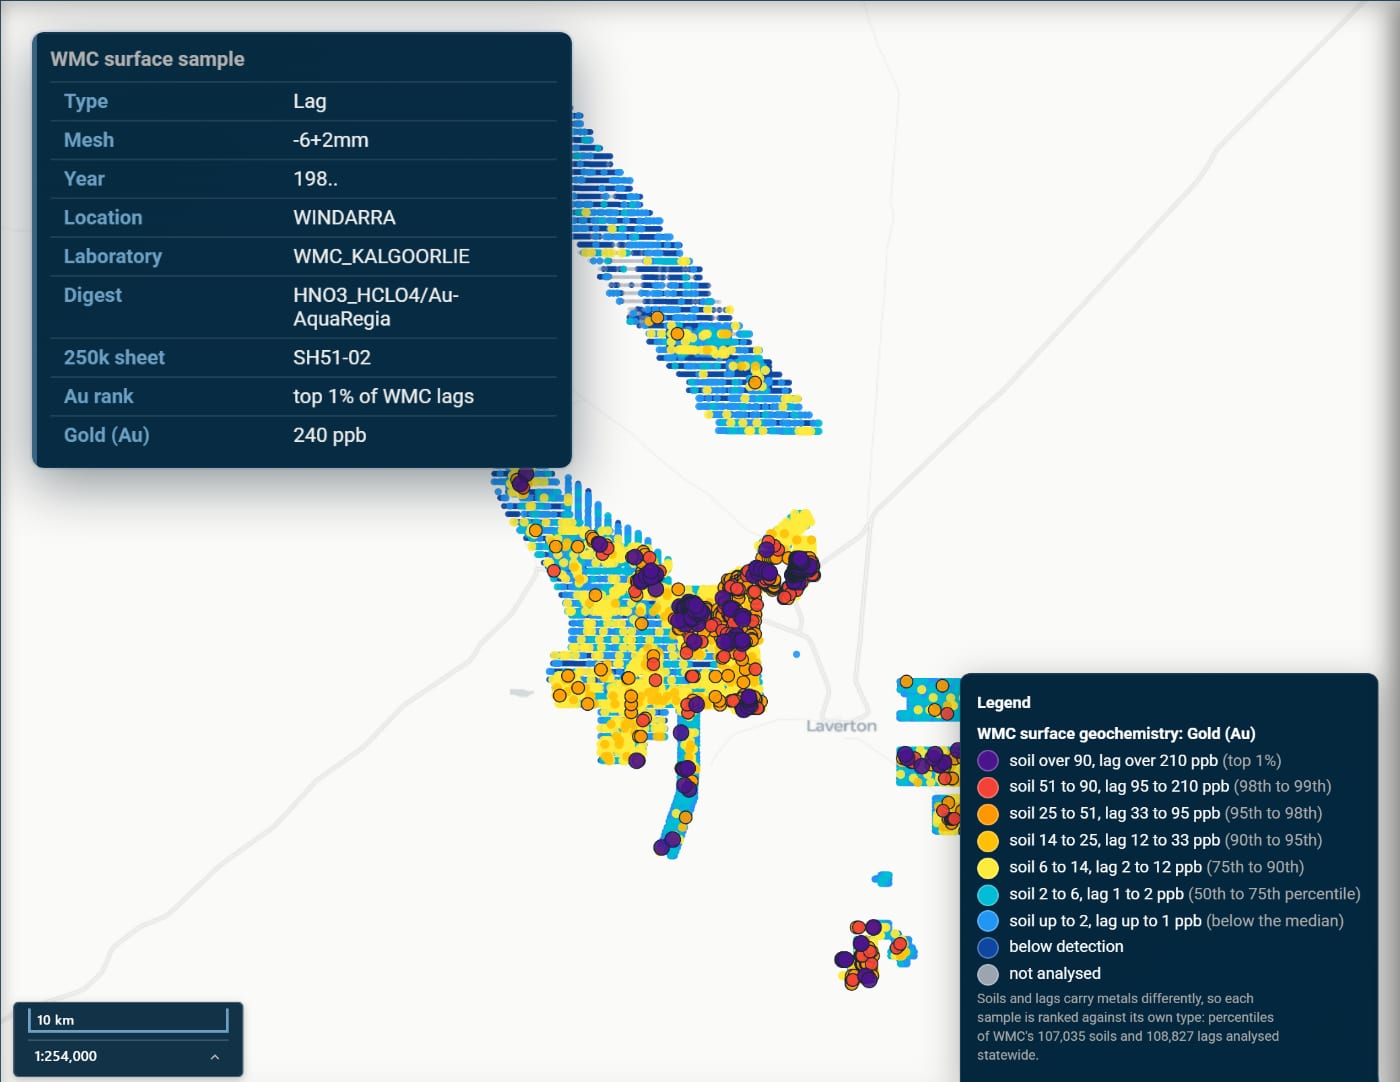
Western Mining Corporation's soil and lag sampling, released by GSWA, is now on the map as WMC Surface Geochemistry: 262,146 samples, most of them in the Yilgarn goldfields. It is mostly gold, with copper, arsenic, nickel, zinc and others on some samples, and it follows the Element picker. Lags carry gold differently from soils, so each sample is ranked against its own type, a lag against other lags and a soil against other soils, and the legend gives the values for each.
Zoomed out, 10, 3 and 1 km squares show the highest sample in each. Zoomed in, every sample is drawn: click one for every assay it has, with its type, mesh size, year, laboratory and rank. Below are WMC's lines north-west of Laverton, over the Windarra and Beasley Creek ground, with a top 1% gold lag. WMC sample numbers work in the search bar too.
GSWA's gridded maxima
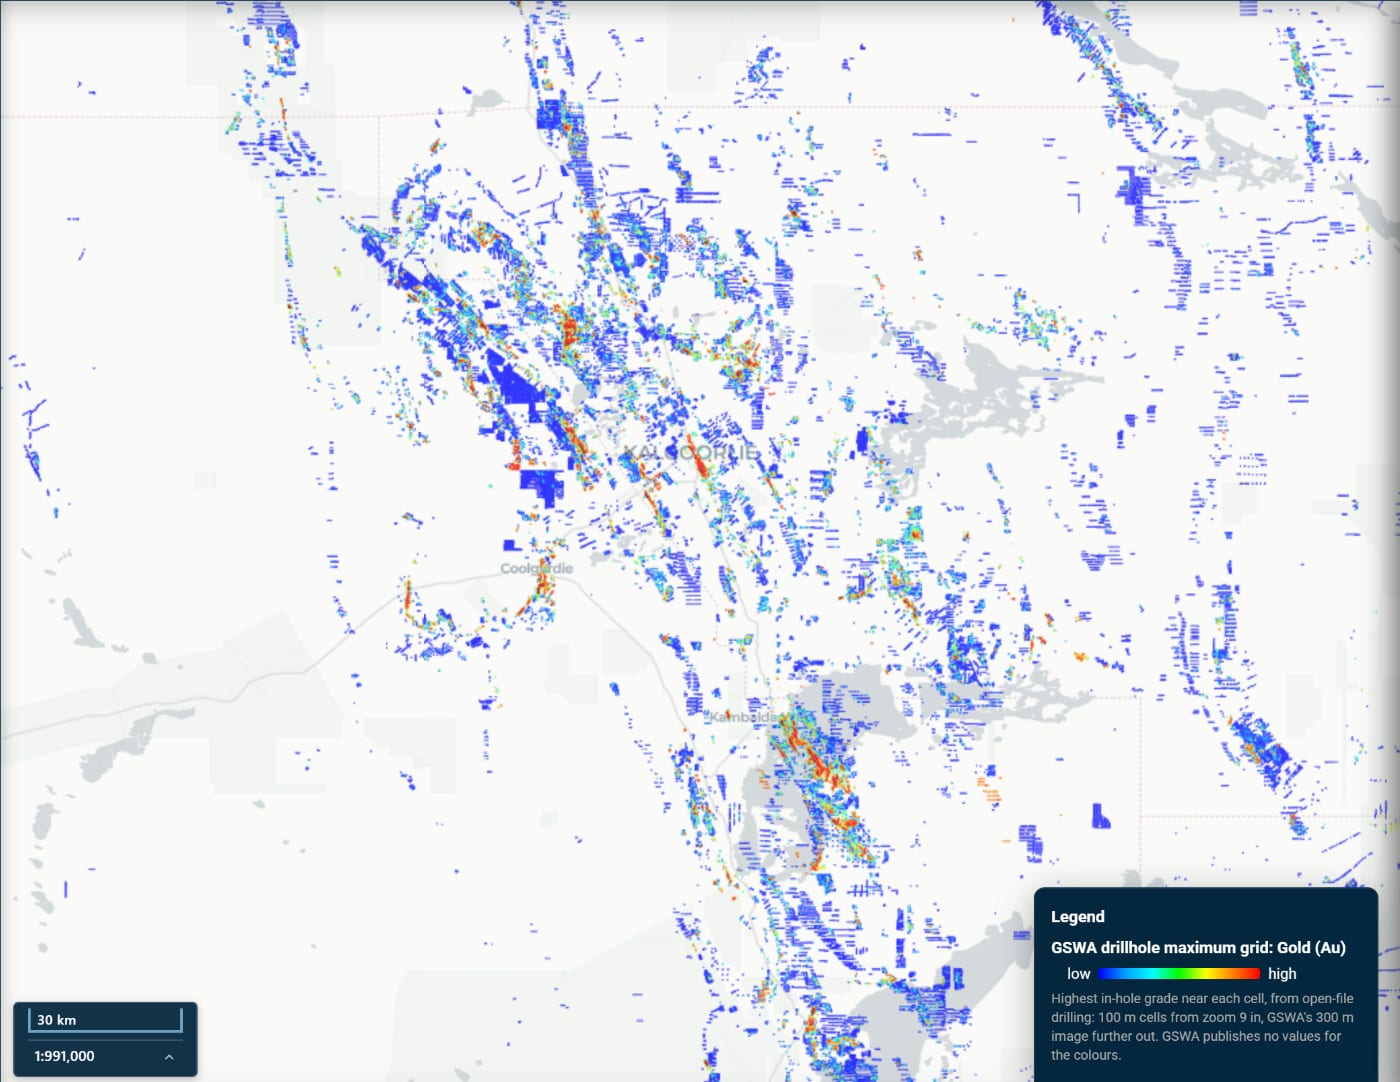
Two GSWA images of the highest values, for reading a district zoomed out: Drillhole Maximum colours each 100 m cell by the highest in-hole grade among the open-file holes around it (300 m cells below zoom level 9), and Soil Maximum does the same for soil samples on 300 m cells. They follow the Element picker for gold, arsenic, cobalt, copper, nickel, lead and zinc. GSWA publishes no values for the colours, so read them as relative: blue low, red high. Below is gold from Kalgoorlie to Kambalda.
Groundwater chemistry
Where sand, clay or a salt lake hides the rock, soil sampling finds nothing. Groundwater has sat against the bedrock, so it can still carry a signal from mineralisation underneath. Groundwater Chemistry (CSIRO) has 7,003 samples from bores and wells, from CSIRO's Continental Scale Hydrogeochemical Data Collection, analysed for metals at parts per billion and below. Most are in the Murchison, the north-eastern Yilgarn and the Capricorn, a few kilometres apart. There are few around Kalgoorlie.
Colour them by one of CSIRO's exploration indices, or by the Element picker:
- Gold index (AuMin): gold, silver and arsenic together, for regional gold targets.
- Nickel sulphide index (NiS): nickel, cobalt, tungsten and platinum.
- Acid sulphide index (AcidS): molybdenum, barium, lithium and aluminium, which rise where acid from weathering sulphides attacks the rock around them.
- Barren sulphide index (FeS): pH, Eh, iron and manganese, for barren, iron-rich sulphides weathering.
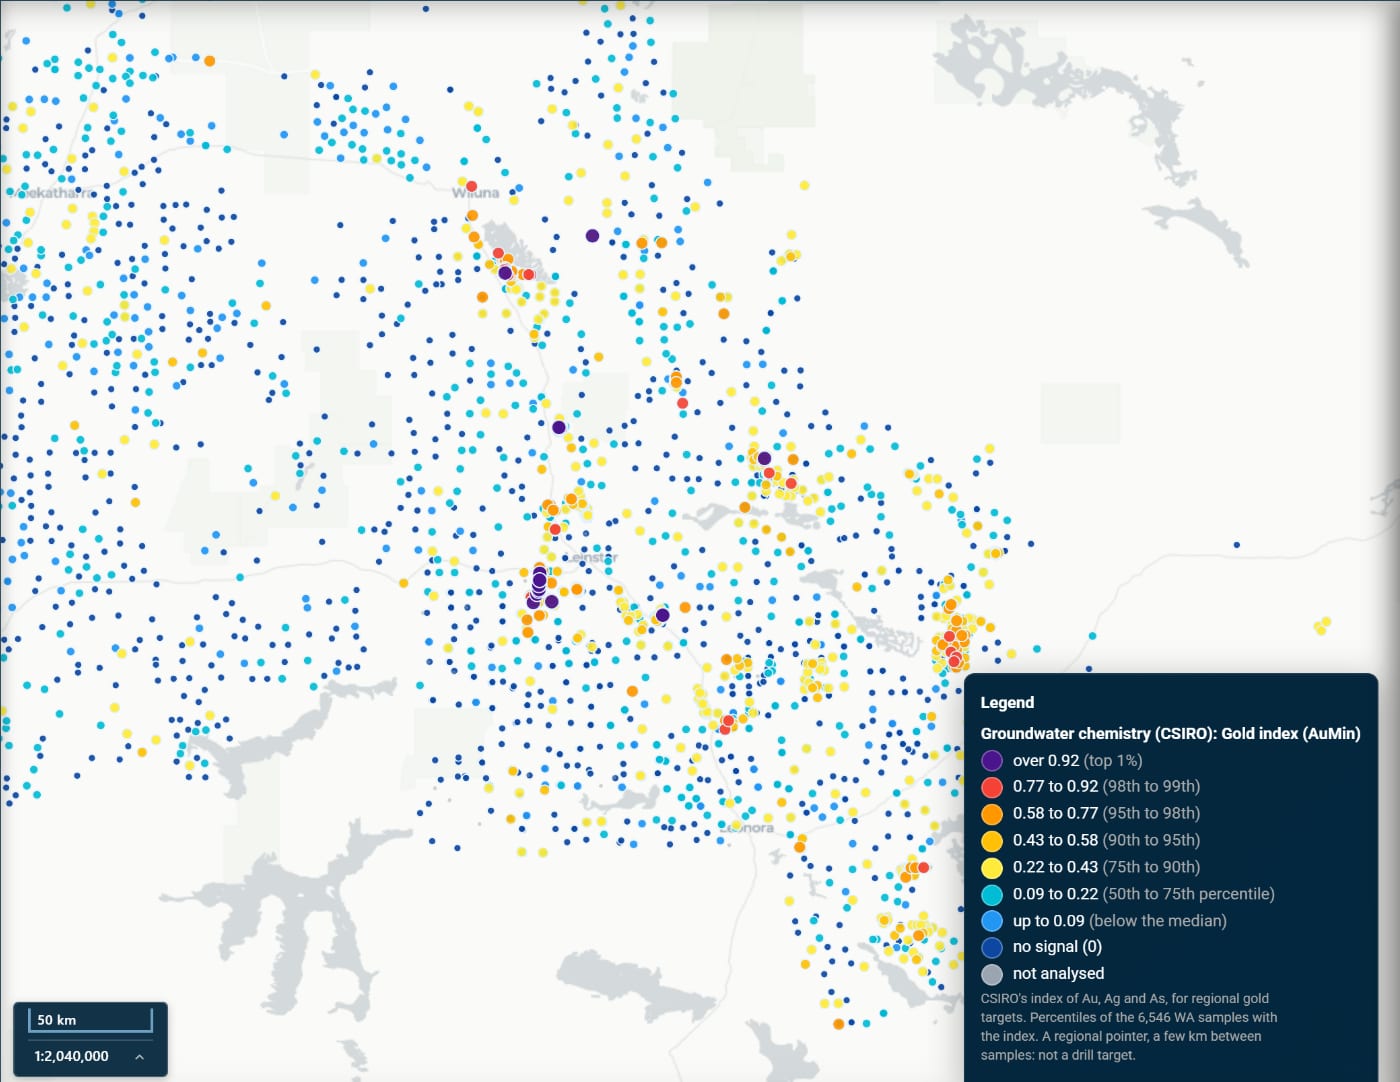
Click a sample for its indices, metals, pH, salinity, depth to water and how it was taken, with CSIRO's rating of how far the bore itself may have contaminated it. Read a high sample as a reason to look at the ground around it, not as a drill target: pH, salinity and the bore all change what the water carries.
Mills and processing plants
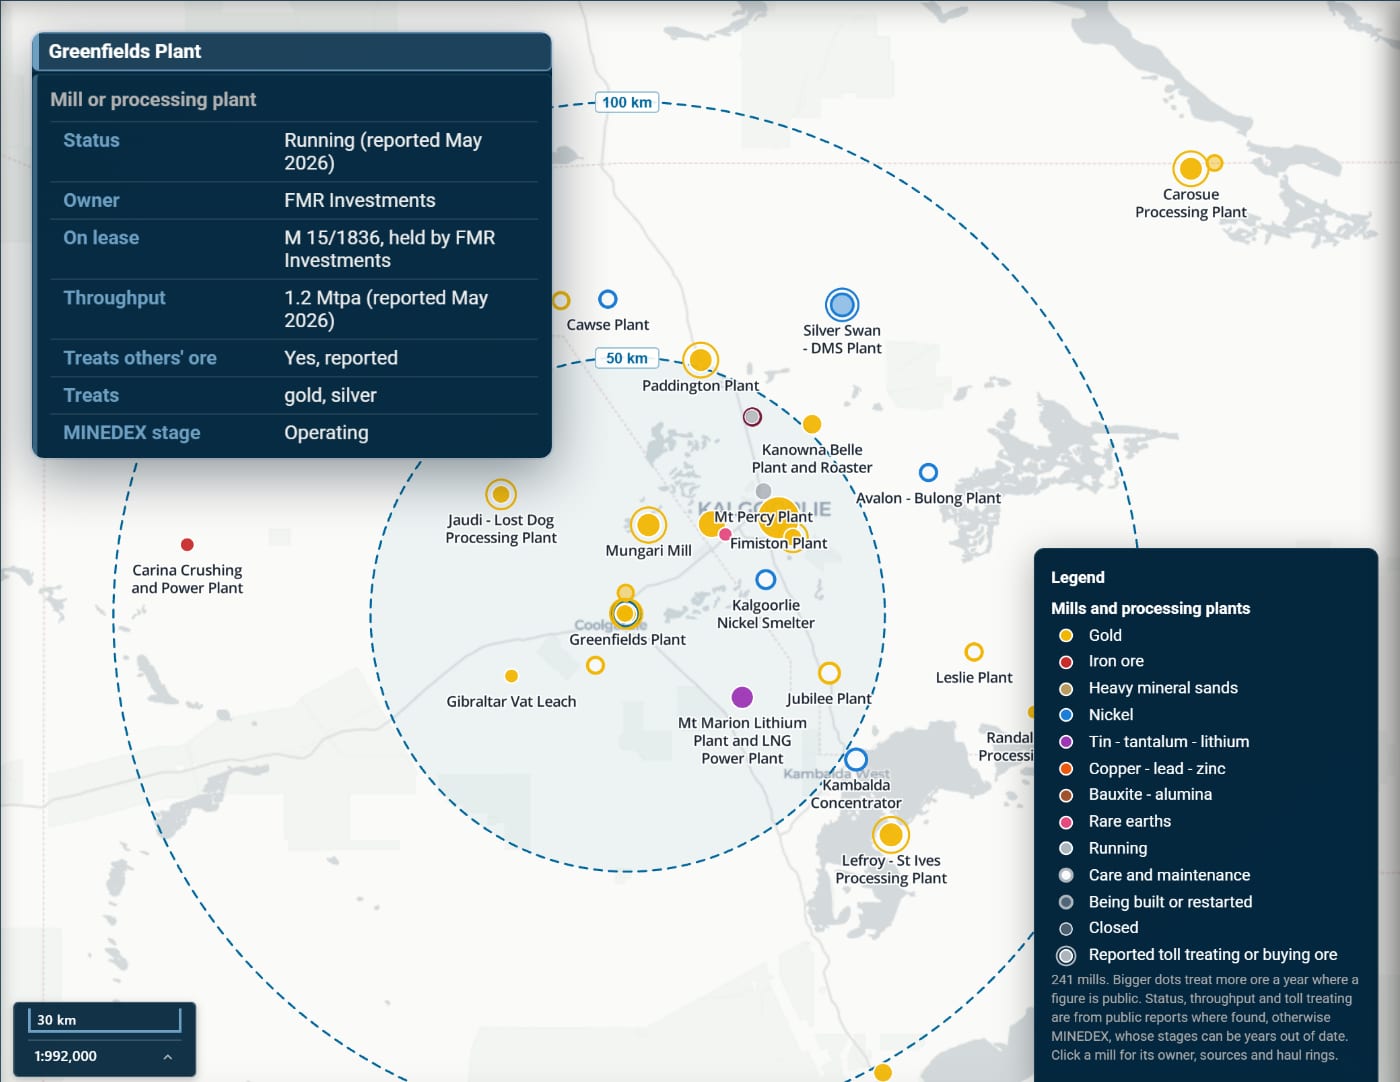
Mills and Processing Plants, under Operating Mines, answers the questions a small deposit raises: which mills are within trucking distance, who owns them, are they running, and do they take other companies' ore. It has about 240 plants that are running, on care and maintenance or being built, one point each. MINEDEX lists a plant as several records (its crusher, leach tanks and gold room); here they are one mill.
- Colour is the commodity, fill the status (solid for running, hollow for care and maintenance, faint for a plant being built or restarted) and size the throughput, where a figure has been published. An outer ring marks a mill reported to toll treat, custom mill or buy other companies' ore in the last three years.
- The owner is the holder of the mining lease under the plant, traced to its parent company, so it stays current when a plant changes hands.
- For the metal mills, status, throughput and toll treating come from public reports such as quarterlies and news, each dated and linked, and re-checked about every three months. Where no report settles a status, the plant shows its MINEDEX stage and says so.
Click a mill for its record, and Show 50 and 100 km haul rings to see what's in range. Below is FMR Investments' Greenfields mill at Coolgardie, reported running and treating ore for other companies. The rings are straight-line distance and the road is always longer, so confirm with the owner before you plan around a mill.
The same mills appear as Nearest mills on a tenement card: the three nearest metal mills within 150 km of the title's boundary, plus the nearest toll treater if none of the three is one. They are also in every Tenure Pack and beside marketplace listings.
Regolith, twice
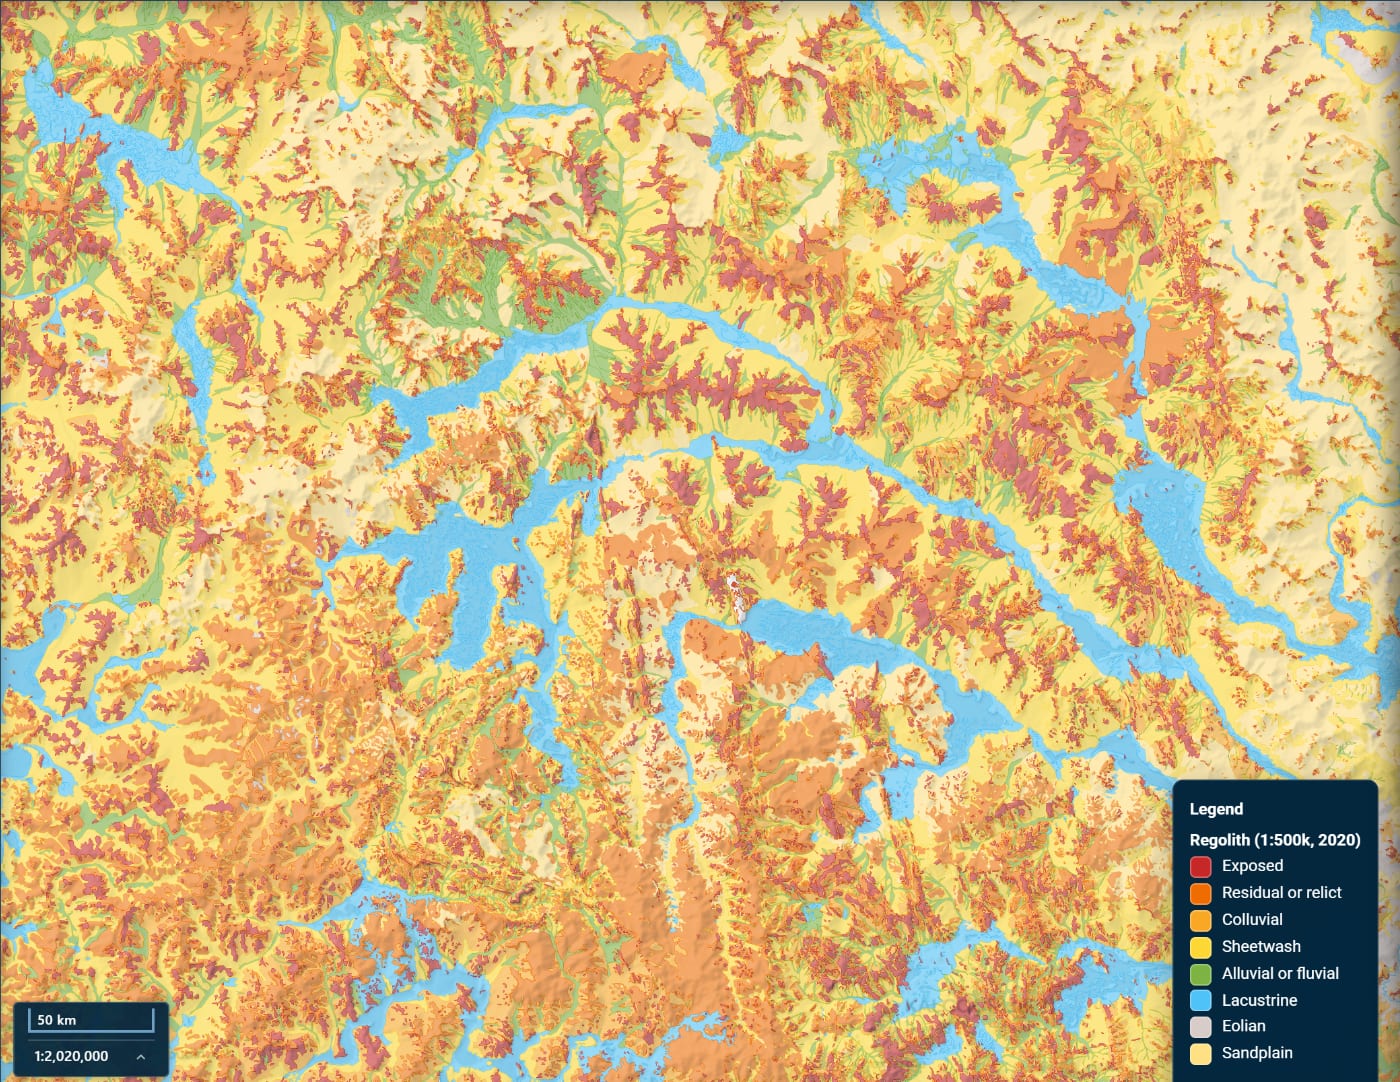
Two GSWA regolith maps replace the 2003 layer. The 500k State Regolith Geology (2020) classes what covers the ground statewide: exposed and residual ground, where bedrock or rock weathered in place is at the surface; colluvium and sheetwash, which have moved a short way; and alluvial, lake, eolian and sandplain cover. The 100k Regolith Regimes (2022) splits the 1:100,000 regolith into three: exposed, residual or relict, and depositional. Together they are the quickest read of where the rock is near the surface, for sampling or detecting. Below, the 2020 map lies over shaded relief in the central Yilgarn.
Historical tenement plans
Historical Tenement Plans (DMPE), in the Tenements and WAMEX section, outlines the area each of DMPE's scanned historical tenement plans covers: the old goldfield plans, and among them the 1:10,000 Kalgoorlie and Boulder series. Old leases on these plans point to old workings. Click inside an outline for every plan covering the point, most detailed first, with its scale, the years each edition was in use, and links to each edition's scan on DMPE's GeoDocs.
Sharper magnetics, and a survey's own grid
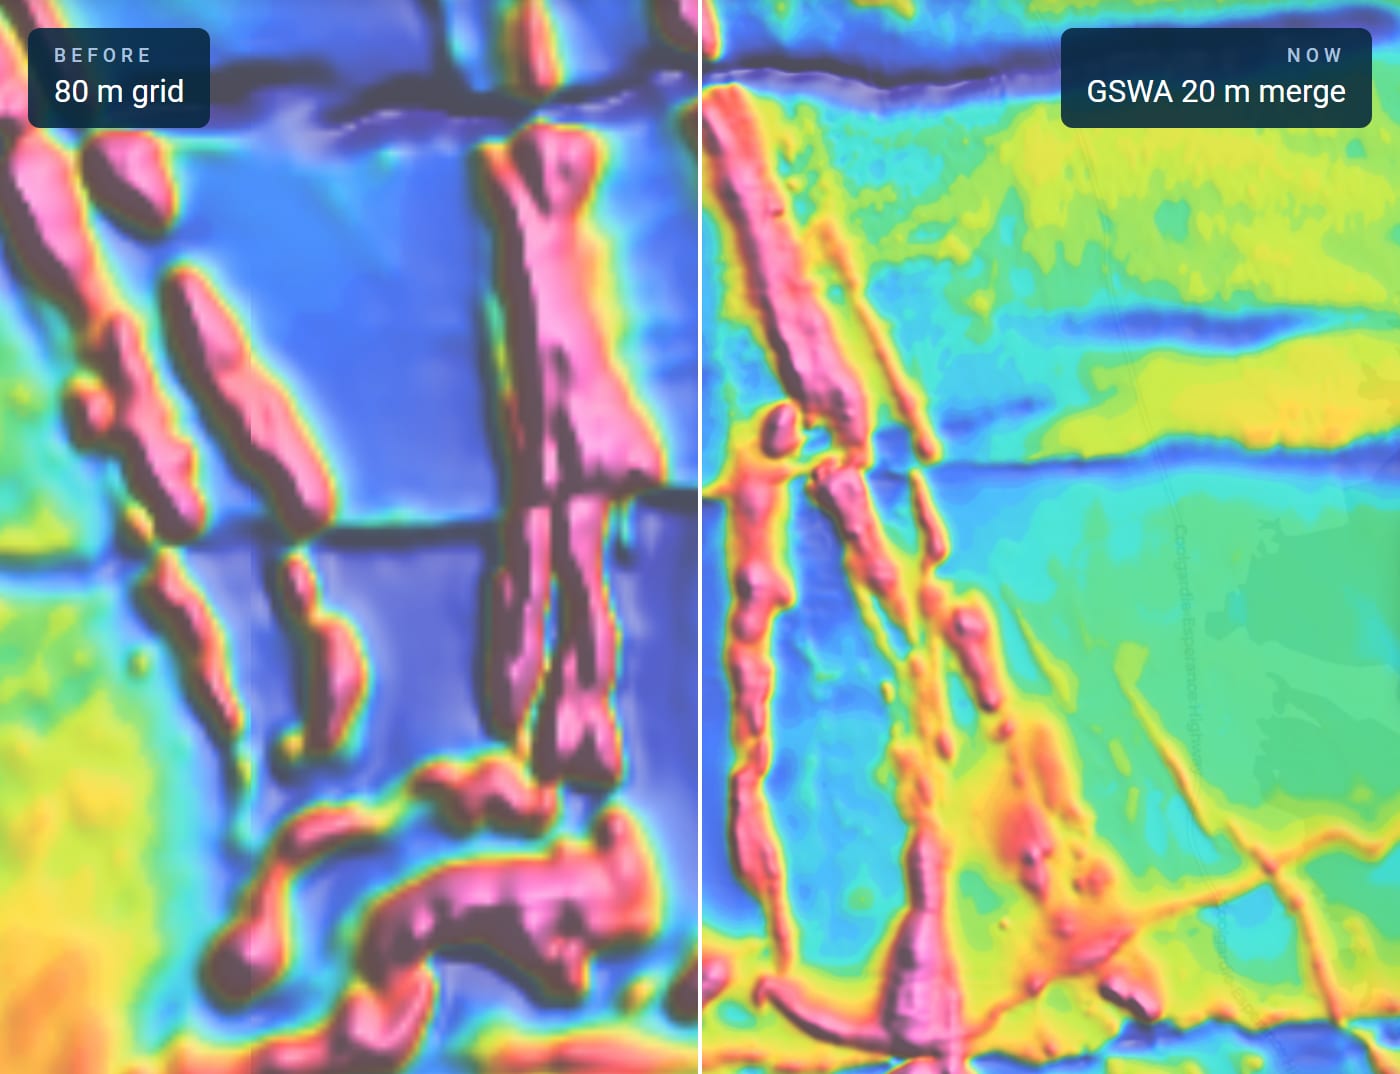
Statewide TMI now comes from GSWA's 2026 20 m merge, to zoom level 13, and RTP, TMI 1VD and RTP 1VD from its 40 m merge, to zoom 12. All four were 80 m. Below is the same TMI view near Widgiemooltha, with the old tiles on the left and the new on the right.
For a public survey with a GSWA download, the MAGIX survey card now has Add to map, which draws the survey's own grid at its own cell size, usually 10 to 100 m, with the same stretch, colours, sun and value readout as the statewide layers.
And two tools for figures of your own ground. Fit to, on a geophysics colour bar, stretches the colours to the values inside a selected tenement, survey or reserve, so a strong body next door no longer flattens the anomalies on your ground. Mask, on a tenement card, shows the geophysics, imagery and geology only inside the title and dims the rest. One click on the holder's name adds their other live titles, and the mask carries into map exports.
Also faster and easier to read
- MINEDEX now draws every site at every zoom, coloured by commodity, shaped by site type and patterned by stage, so zoomed out across the state it reads as a map of what is mined where. The Mine Filter can now filter by stage, such as operating only.
- GSWA Geochemistry (regional) is drawn at every zoom and coloured by the Element picker, as percentiles of every GSWA sample analysed for that element.
- Open-file drillholes show as drilling density squares zoomed out, and every collar in view from zoom level 11.
- The Layers tab is grouped by purpose: tenure, land access, geoscience, satellite and reference.
It's all on the map now, and the map guide covers each layer in more detail.
Track WA tenements and find ground to peg, sell or buy
NextMaps gives exploration companies and investors instant visibility over the full WA tenement landscape.
Get started →