
Follow the ground, not the company
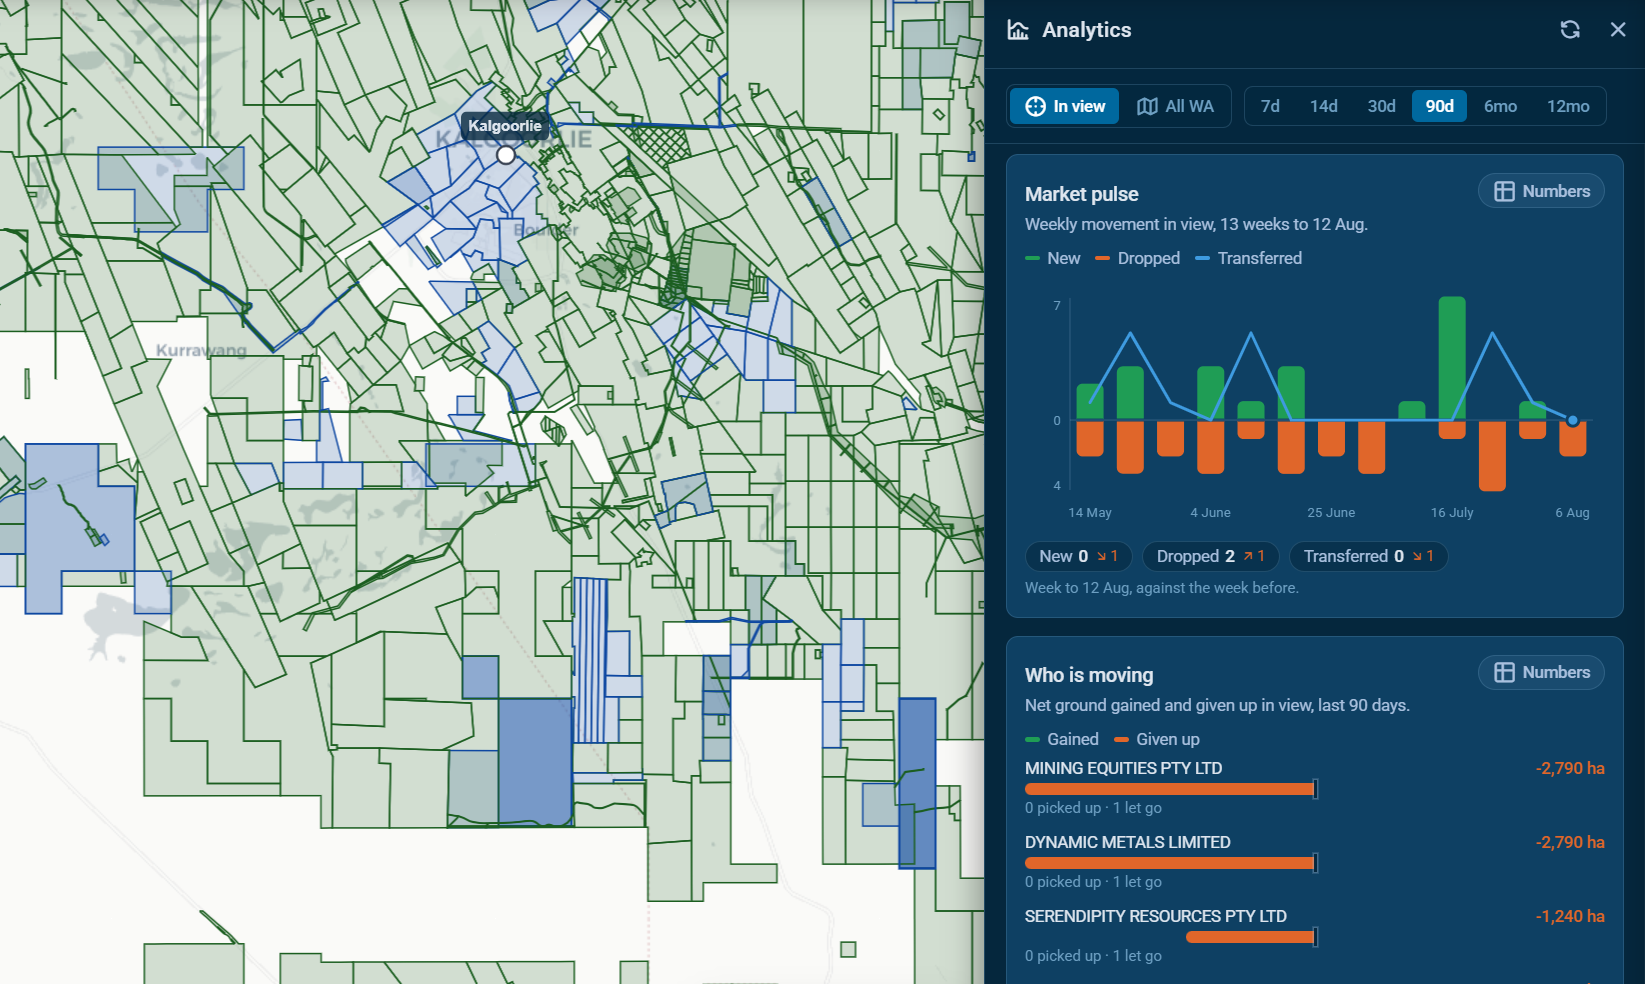
The analytics panel in NextMaps has been rebuilt on our own copy of the WA tenement register. Five cards: what was pegged and dropped week by week, who is gaining and giving up ground, transfers grouped by the deal rather than by the tenement, new tenure pegged on parcels someone just walked away from, and the make-up of whatever tenure is on your screen. It is the WA Mining Weekly, scoped to your viewport and available whenever you want it.
The old analytics panel drew one thing: a statewide bar chart of whoever had pegged the most ground in the window you picked. It was a perfectly nice chart. It also answered a question almost nobody was asking, and if we're being straight about it, almost nobody opened it.
So we rebuilt it from scratch. The panel now reads our own copy of the WA tenement register and the change log behind it, and it follows your map. Pan to a belt, and every card re-reads itself for that ground.
What moved, week by week
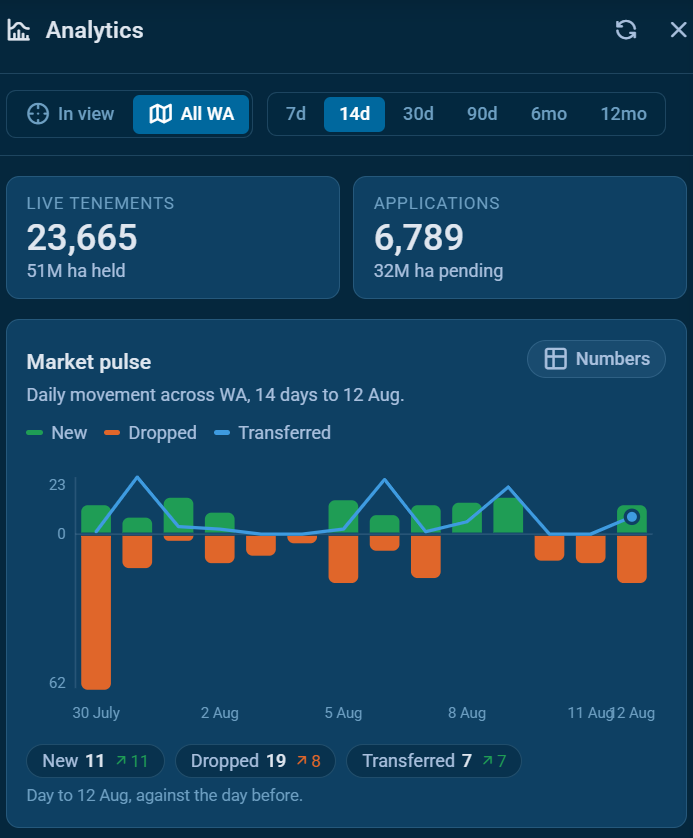
Market pulse puts new tenure above the line, dropped tenure below it, and transfers as a line across the top, so a busy week has a shape you can read in a second. Choose 7 or 14 days and it switches from weekly bars to daily ones, because a seven day window drawn as a single weekly bar is a number pretending to be a trend.
Who is gaining, and who is letting go
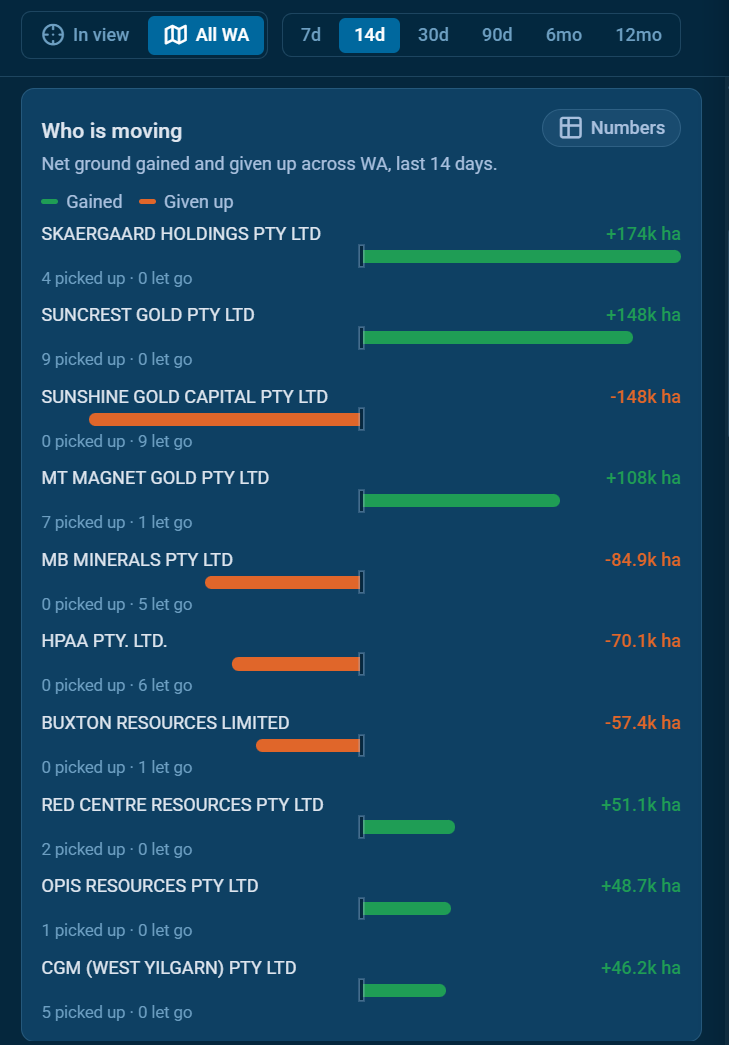
Who is moving ranks holders by net hectares over the window, gained to the right and given up to the left. The old panel only ever counted grants, which made every quarter look like expansion. Ground given up is half the market and usually the more interesting half.
Transfers, grouped by the deal
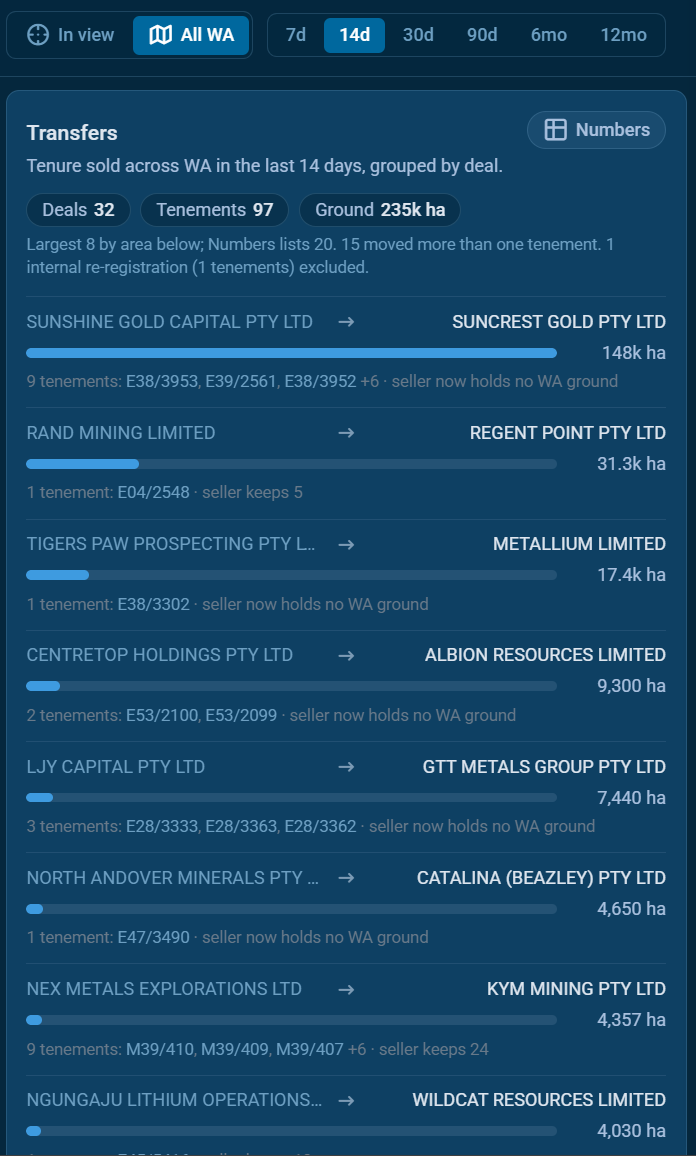
This is the card we most wanted. The register records a transfer one tenement at a time, so a single transaction arrives as thirty-two separate rows. Transfers groups them back into the deal they came from.
The difference is not cosmetic. In a recent quarter, Nifty Copper transferred 32 tenements covering 152,709 hectares to Paterson Exploration. Counted tenement by tenement, that appears as two unrelated companies, one shedding ground and one acquiring it, with nothing on screen connecting them. Counted properly, it is one line and one story.
We also drop the noise. A company moving titles between its own entities, Manda Resources Pty Ltd to Manda Resources Ltd, is a re-registration and not a sale, and those are filtered out and counted separately. Same for an individual recorded under a fuller version of their own name. Where the seller ends up holding no WA ground at all, the card says so, because that is usually the real story.
Ground changing hands
Here is something we found while building this, and it changed the design.
Tenure movement in WA is nuggety. Across twenty-one weeks of our own change log, 526 of 956 holders appear in exactly one week, and only fifteen appear in eight or more. There is no recurring cast of companies to follow. Follow companies and you are watching one-offs.
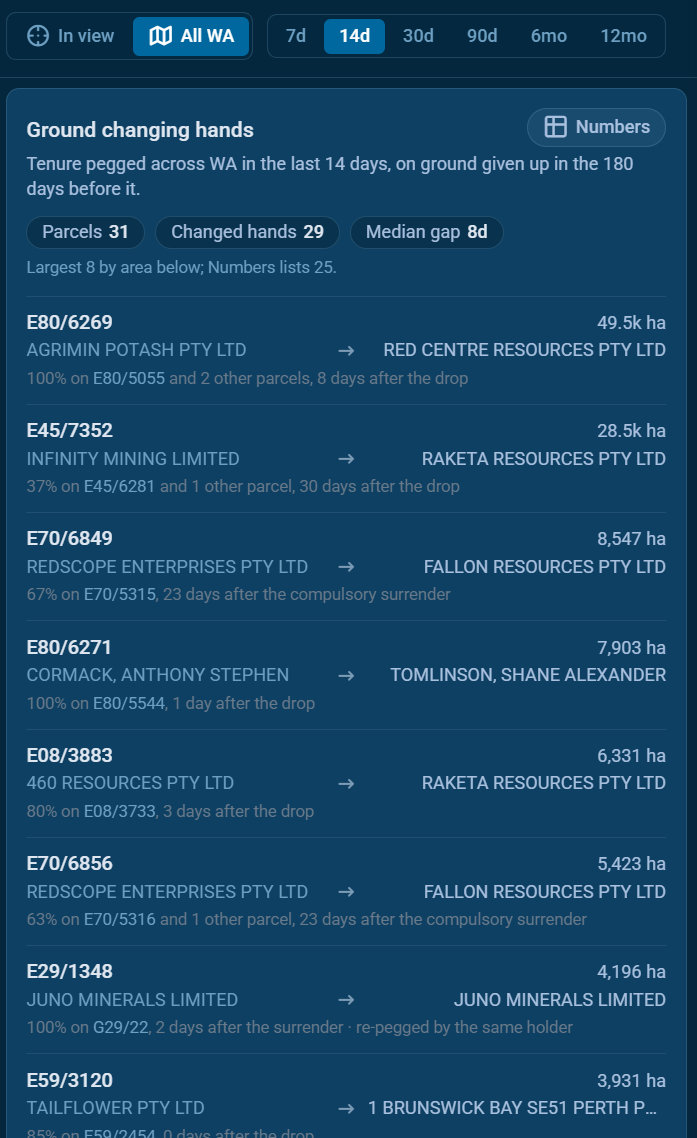
The recurrence is in the ground. Of 1,176 new tenements in that same history, 252 sat at least a quarter on ground that someone had dropped or surrendered within the previous 180 days, and 230 of those went to a different party. The median gap between the drop and the new peg is about a week.
That gap is exactly why this needed its own card. The drop and the re-peg land in different weeks, so the pulse sees two unrelated bars and the transfers card sees nothing at all. Ground changing hands stitches them together: the parcel, who let it go, who picked it up, how much of the new tenure sits on the old footprint, and how many days passed. Click either tenement to send it to the results panel. The released one still draws, even though it no longer exists as live tenure.
What your screen is actually made of
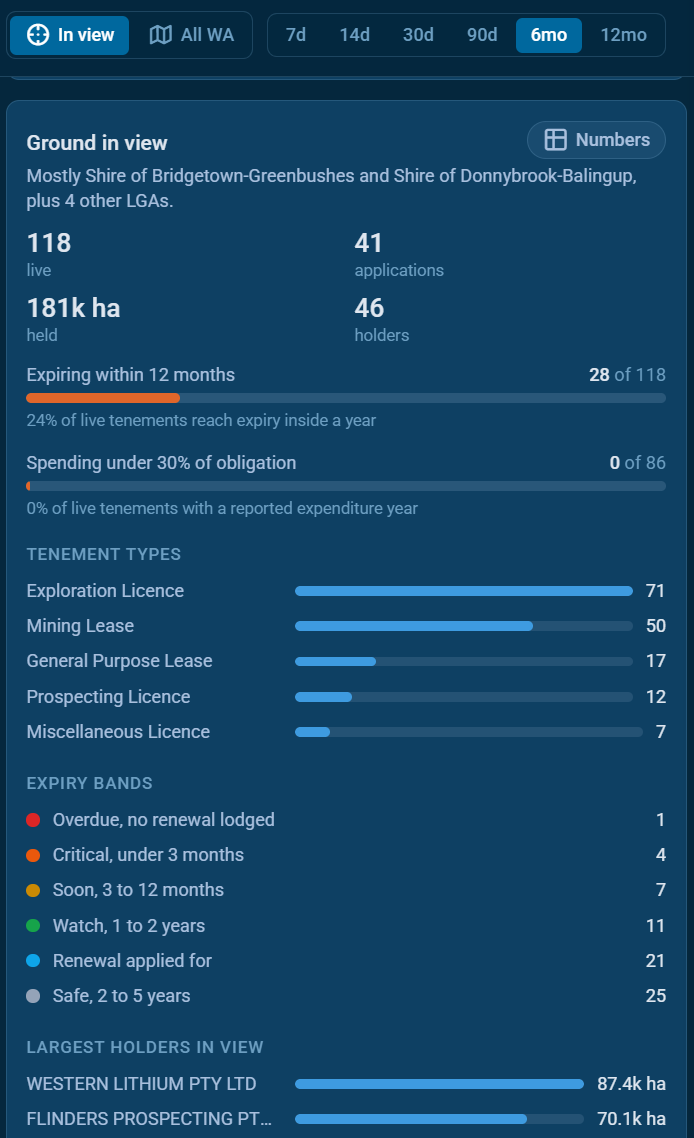
Ground in view is the card the old panel had no answer for, because it drew statewide charts while ignoring the map completely. It names the LGAs you are looking at, then breaks the tenure down: live against pending, ground held, how much reaches expiry inside a year, how much is spending under thirty per cent of its expenditure obligation, the tenement types, the expiry bands, and the largest holders. Click a holder to frame their tenure on the map.
The weekly, on demand
If you have read the new Nextmaps newsletter, WA Mining Weekly, this will feel familiar, and that is deliberate. The newsletter reads the same register and tells you what moved across the state last week, written up with the context around it. It arrives once a week, and it decides what is worth your attention.
The panel is the other half of that. Same data, same definitions of what counts as a deal, but scoped to whatever is on your screen and available the moment you want it. The weekly answers "what happened in WA". The panel answers "what about here, and what about right now". If the weekly mentions a district and you want to go and look at it properly, the panel is where you land.
Two honest notes
Our own change log starts in March 2026, so a twelve month window is bounded by that rather than by the register's full history. The panel tells you the coverage date at the bottom rather than quietly padding it out.
And every chart has a Numbers button. It opens the same figures as a table, including rows the card does not have space to draw, so nothing is locked behind a hover.
The analytics panel is part of Pro. Open the map, hit Analytics on the right edge, and pan to ground you know.
Track WA tenements and find ground to peg, sell or buy
NextMaps gives exploration companies and investors instant visibility over the full WA tenement landscape.
Get started →