
WA terrain moves on a generation: 15 m shaded relief, statewide
For 25 years, statewide terrain for WA has meant about 30 metres a pixel. The shaded relief on the NextMaps map now comes from a 15 metre model built from recent satellite imagery, the biggest step since SRTM was flown in 2000. Pits, dumps, creek lines, breakaways and strike ridges that used to be a blur are now clear. Here is what changed, and how prospectors and field crews can use it.
For 25 years, terrain on a WA exploration map has meant SRTM, the radar elevation model flown on the Space Shuttle in February 2000. Everything statewide that has come since has been about the same 30 metres a pixel, and anything finer has only existed in patches. A whole generation of geologists has planned field programs on it.
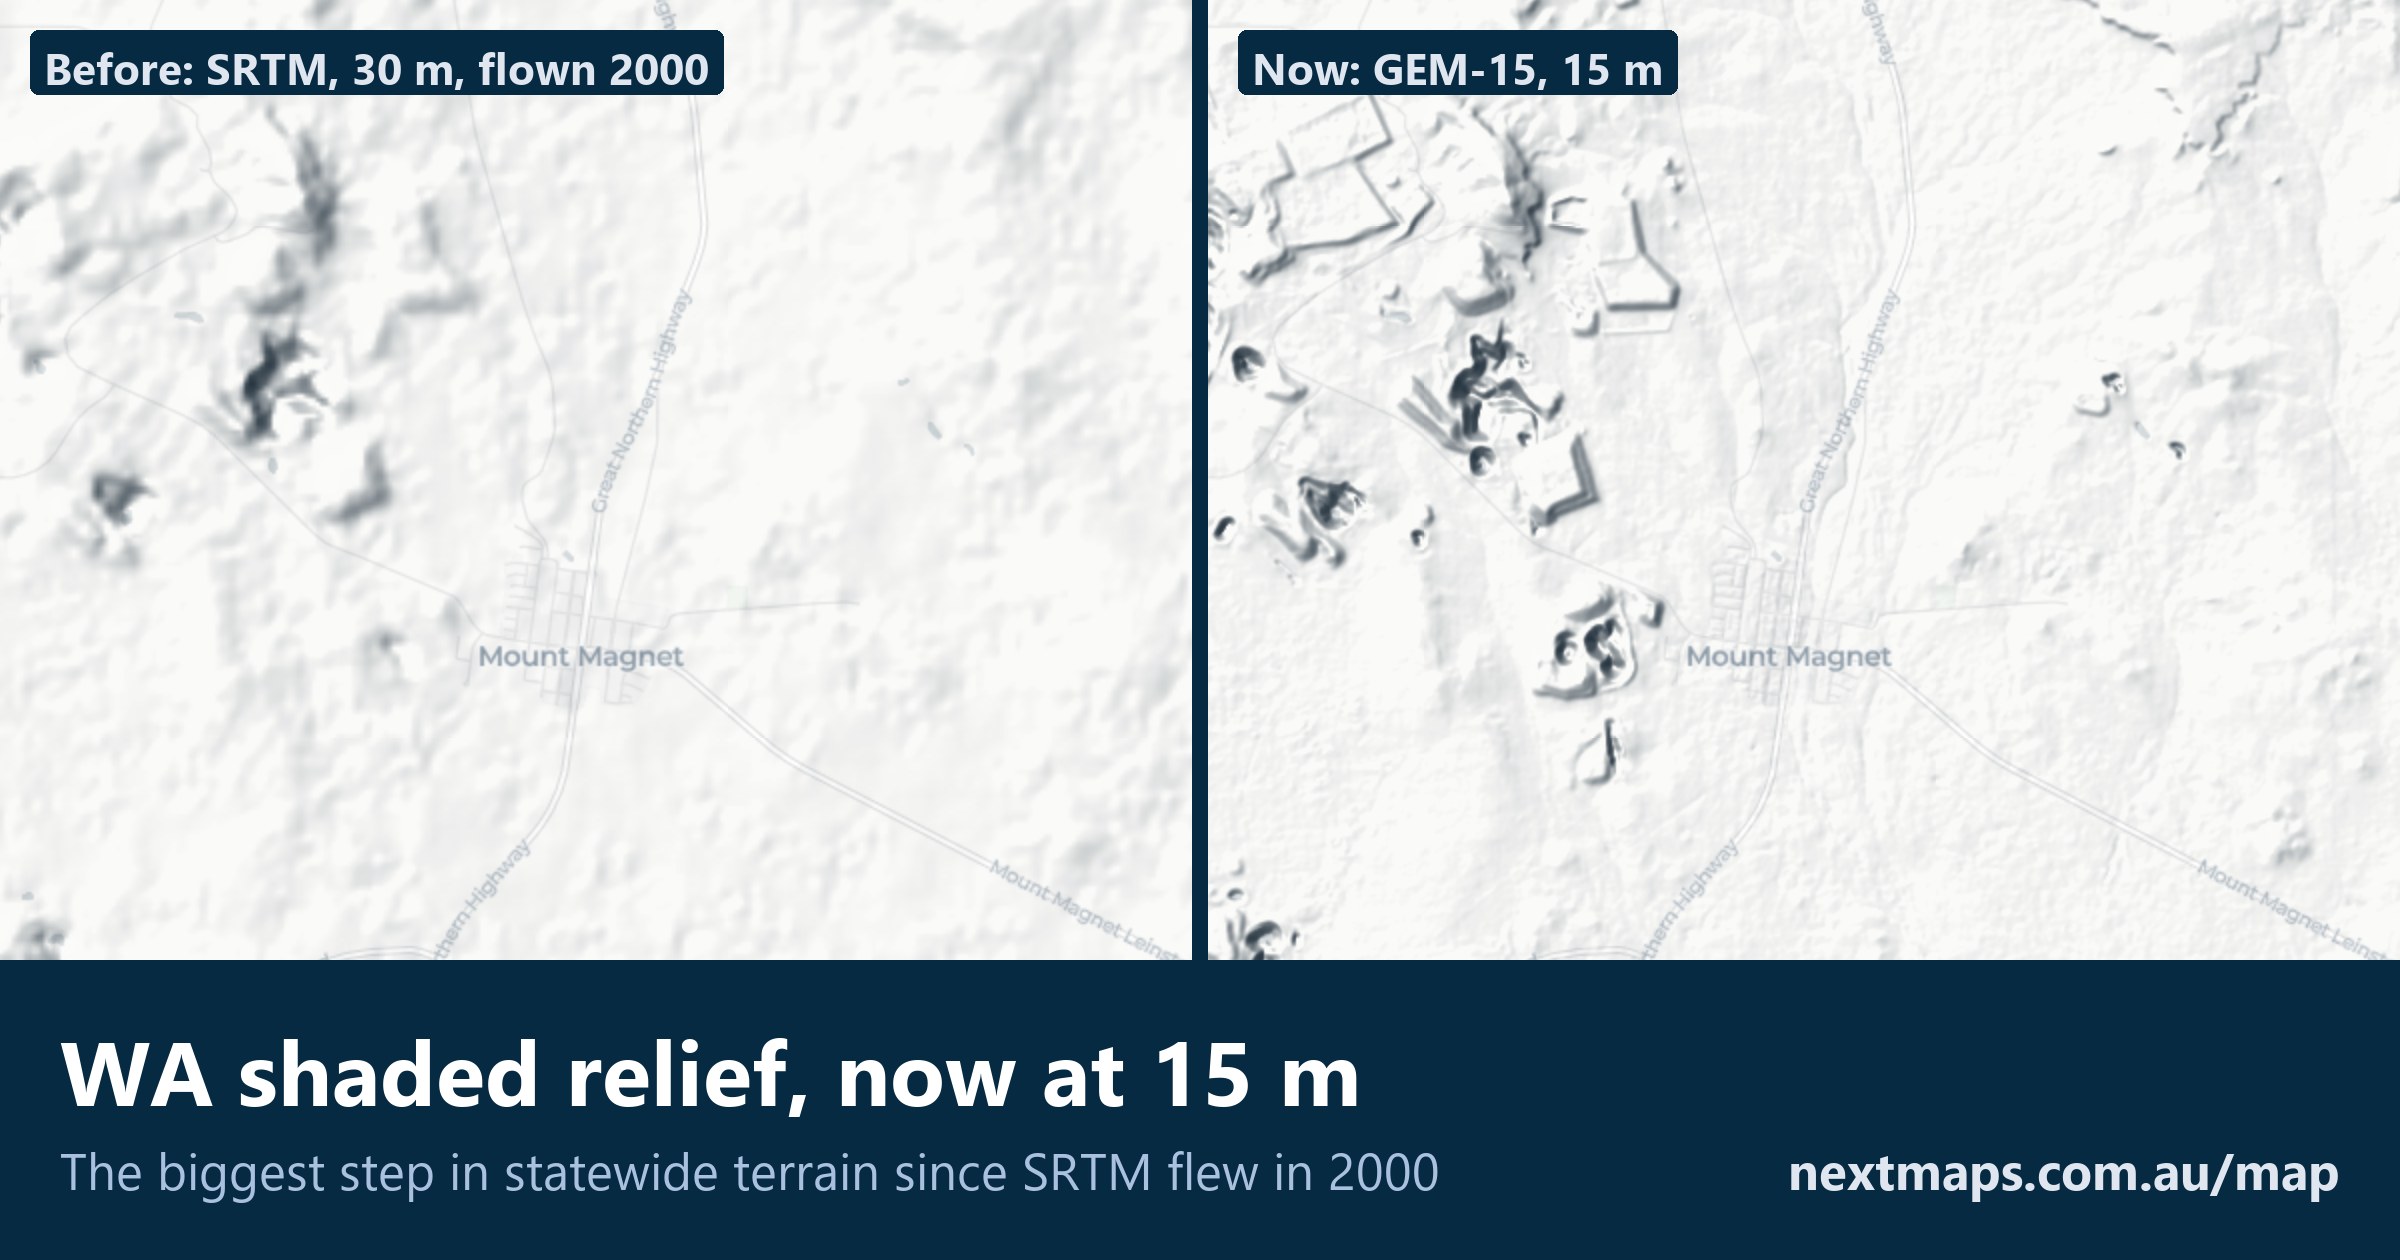
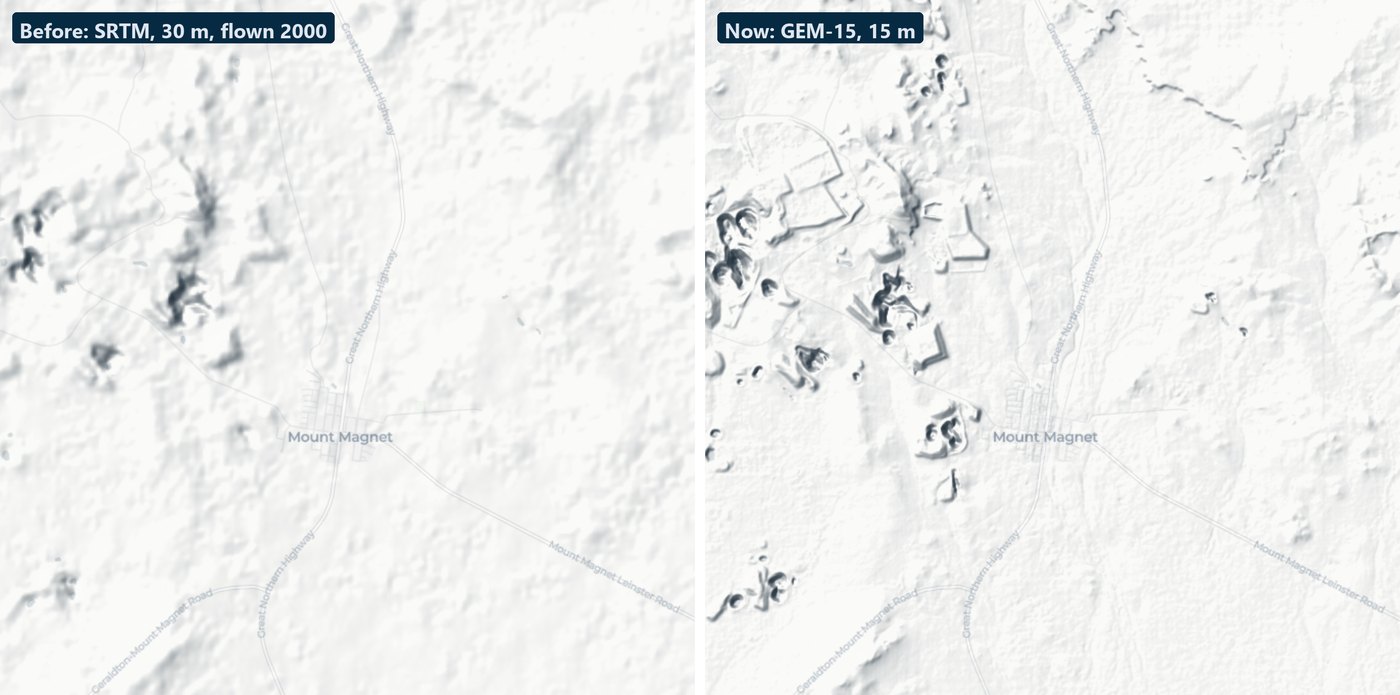
That has just changed. The shaded relief on the NextMaps map now comes from a 15 metre model built from recent sub-metre satellite imagery (Google's GEM-15, a bare-earth model released under an open licence), across the whole of Western Australia. This is the biggest step in statewide terrain since the Shuttle flew. On paper it is twice the resolution. On the ground it is a different map: the old model was smoothed and 25 years out of date, and this one is neither. Below is Mount Magnet, the old model on the left and the new one on the right, at the same view and the same light.
Turn it on with the Relief button in the status bar at the bottom of the map. It sits over any basemap and under your tenements, geology or geophysics.
What you can see now
- Drainage: creek lines, gullies and the edges of alluvial flats, down to channels a few tens of metres wide
- Breakaways and scarps: the actual edge, not a soft slope somewhere near it
- Strike ridges and dykes: narrow resistant units stand up as lines you can follow across a tenement
- Mining as it is today: open pits, waste dumps, tailings dams and haul roads, including everything built since 2000
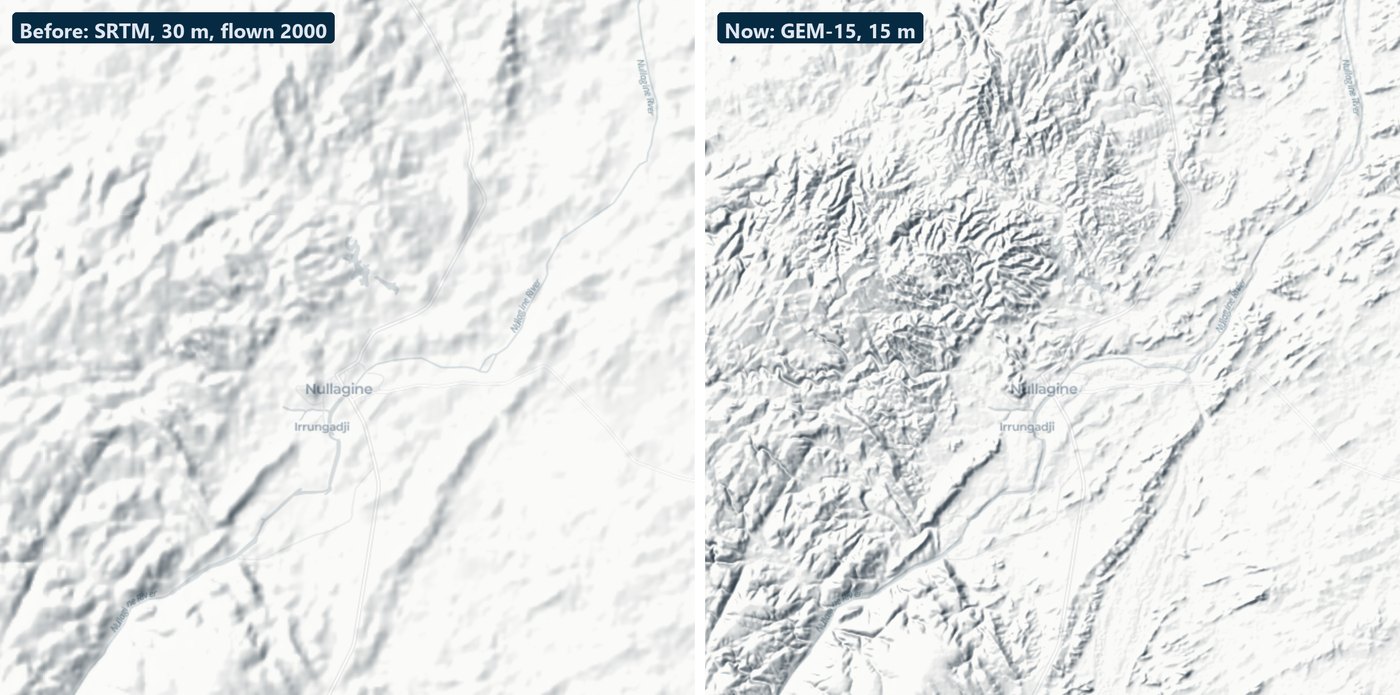
Around Nullagine the difference is the ground itself. The old model gives a general impression of hills. The new one shows every ridge and gully, and you can read the geology straight off the landforms.
For prospectors
- Read the ground before you drive to it. Gullies below a reef line, the foot of a breakaway, the inside bends of a creek: the places gold sheds to and collects in are landforms, and most of them are now visible from your kitchen table.
- Find the old workings. Pits and dumps of any size show up, including ones that are on no map. Lay the historical tenement plans or MINEDEX over the top and you can match a name to a hole in the ground.
- Know what you are pegging. A block that is half salt lake or cut by a breakaway looks the same as its neighbour on a tenement map. With relief on, it does not.
- Plan the way in. See which side of the range the track has to take before you are standing at the bottom of it.
For exploration geologists and field programs
- Soil and auger programs. Lay the grid against the drainage. Lines that run down an alluvial channel or across sheetwash are samples of transported cover, and you can now see those channels before the crew goes out.
- Stream sediments. Pick sample sites on real channels and see what catchment each one drains.
- Drill planning. Check the slope at a pad, and where a rig and a water truck can approach it, before the site visit. It will not replace the visit, but it will stop you planning a hole in a gully.
- Regolith and landform mapping. Put relief under the radiometrics or the regolith maps: residual rises, breakaway edges and depositional flats sort themselves out quickly when the shape of the ground is underneath.
- Structure. Open the sun dial beside the Relief button and move the light. Lineaments, dykes and strike ridges that vanish under one sun direction appear under another. You can raise the vertical exaggeration to 4× for flat country.
- Field maps. Relief comes through in map exports, and the status bar reads the elevation under your cursor.
The same elevation is in Lightbox, our grid viewer, where you can drape it under the statewide magnetics, radiometrics and gravity or your own survey grid.
Kalgoorlie, 2000 and now
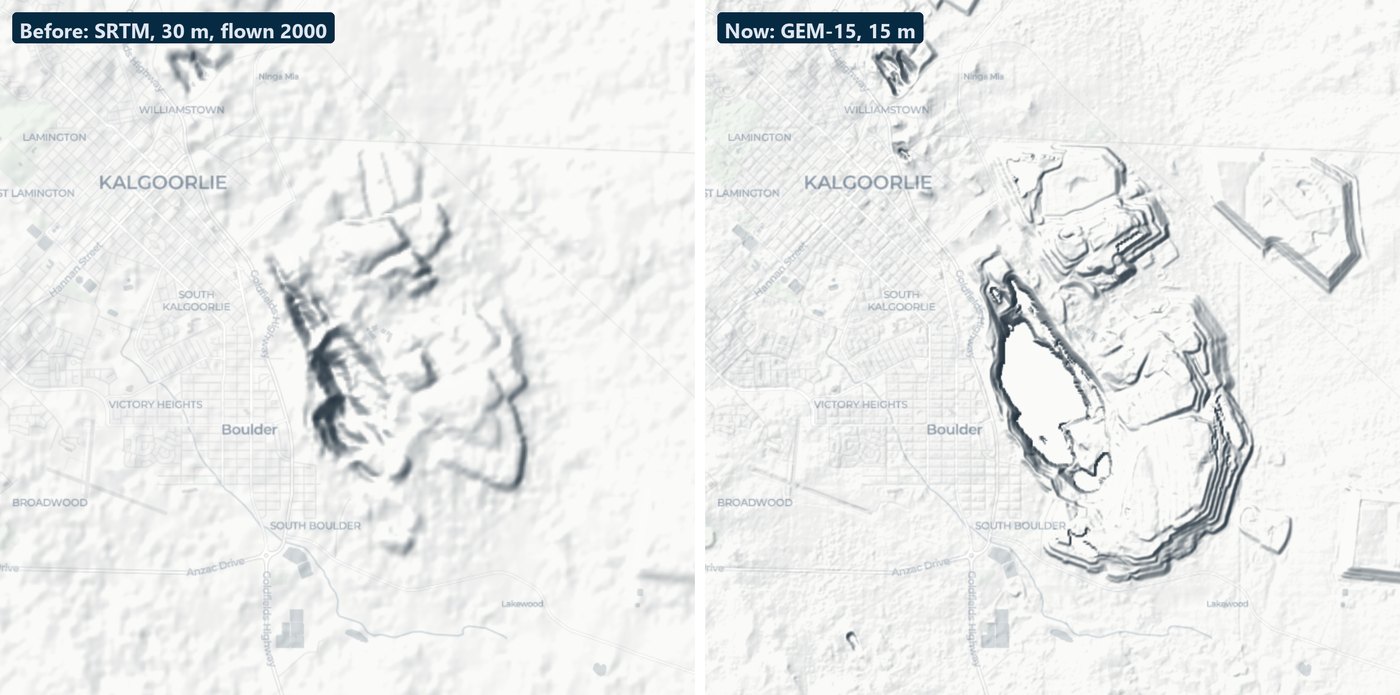
The clearest way to see the 25 years is over a mine. On the left is the Super Pit as the Shuttle saw it. On the right is the pit as it is today, with its waste dumps and the tailings dams to the east, none of which the old model knew about. (The floor of the pit is drawn flat: the satellite model has no data there, so we level it.)
Where it is not perfect
None of this changes the picture above, but we would rather tell you than have you find out in the field.
- Salt lakes and water. A model built from imagery has nothing to hold on to over bare salt or water, so the raw data is noisy there. We replace lake beds and water bodies with the old model, which is flat where it should be. A few rough patches remain on the biggest lakes, and narrow causeways across them are lost.
- Gaps. The new model has some missing strips. Those are filled from the old model, so inside one the detail is softer.
- Tall forest. Under the karri and jarrah of the south-west, "bare earth" still carries some of the canopy.
- It is a 15 metre model. It shows a pit, a dump or a creek. It does not show a shaft, a costean or a drill pad, and it is not a survey: use it to plan, not to set out.
Elevation data: GEM-15 (this dataset is produced by Google, CC BY 4.0), with lakes, water and gaps from the 1 second SRTM DEM-S, © Geoscience Australia (CC BY 4.0).
Have a look at your own ground: open the map, zoom to a place you know well, and press Relief. The map guide covers the light settings.
Track WA tenements and find ground to peg, sell or buy
NextMaps gives exploration companies and investors instant visibility over the full WA tenement landscape.
Get started →