
The WA Tenement Register Was Always Valuable. It Just Wasn’t Spatial.
The WA tenement register has always contained valuable signals, but they were buried across static records, PDFs, and disconnected systems. NextMaps turns that registry data into a spatial intelligence platform, surfacing behavioural patterns around exploration spend, competition, ownership, drilling activity, distress, and ground availability across Western Australia.
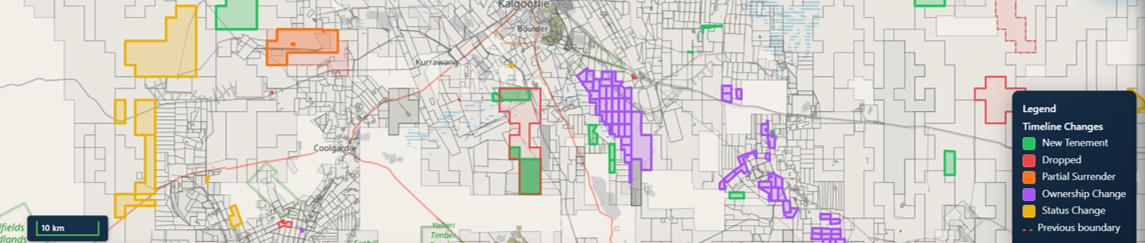
Over the past few months I’ve been integrating the WA MTO Tenement Register directly into NextMaps.
Not just as raw records, but as a fully spatial intelligence system layered across the entire state.
Expenditure, ownership changes, encumbrances, forfeiture notices, expiry timing, heritage activity, application competition, ground release patterns, all updated daily and viewable in geographic context.
The raw data itself has always been public.
The problem is that actually interrogating it properly has historically been fragmented, slow, and non-spatial. Useful signals were buried across PDFs, register entries, disconnected systems and manual workflows.
That’s the gap these new layers are designed to close.
Instead of simply showing tenement boundaries, NextMaps now surfaces behavioural signals:
Where money is moving.
Where companies are quietly retreating.
Where competition is building.
Where drilling is likely coming next.
Where ground is opening up before the market notices.
Below are some of the more interesting examples that emerged while building the system.
Distress Often Appears in the Registry Before It Appears in the Headlines
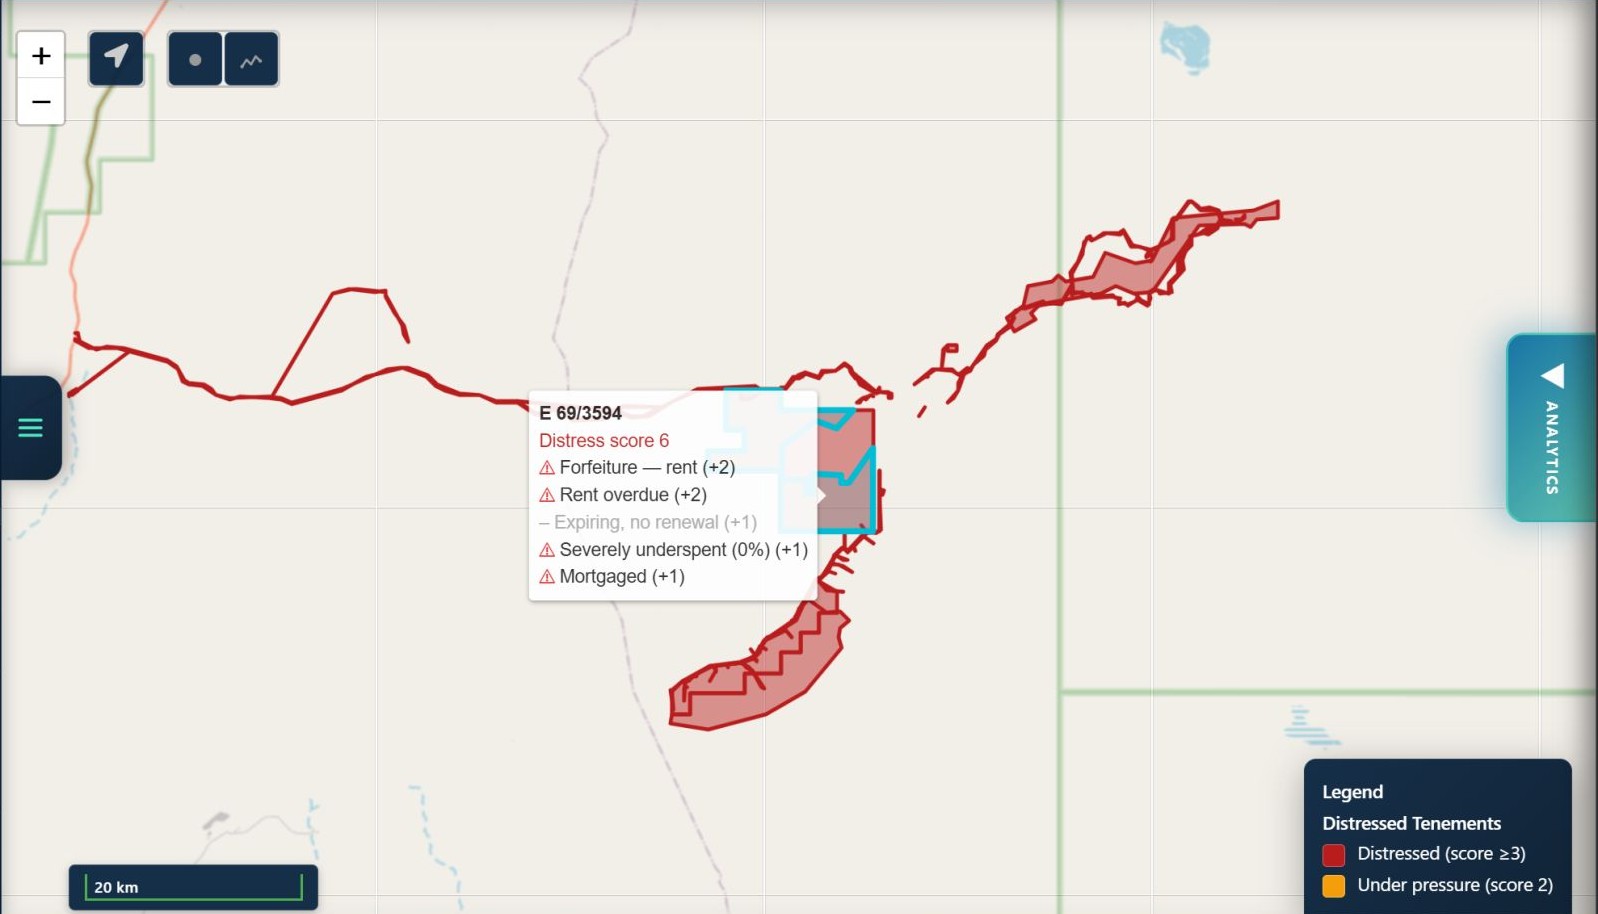
One of the strongest examples came from the former Kalium Lakes Beyondie SOP project.
The Distressed Tenements layer aggregates multiple registry risk factors:
- Active forfeiture notices
- Rent overdue
- Expenditure compliance issues
- Encumbrances
- Upcoming expiry pressure
E69/3594 lit up almost perfectly.
By the time the company entered administration, the underlying tenement position was already showing the strain:
mortgaged ground, overdue obligations, compliance pressure, underspend.
The registry was telling the story before most people would ever read a balance sheet.
That same principle applies more broadly across WA exploration. Administrative pressure tends to leave spatial fingerprints long before formal outcomes occur.
Exploration Spend Becomes Much More Interesting When You Normalise It
Absolute exploration spend can be misleading.
Large companies naturally spend more. Large tenement packages naturally absorb more capital.
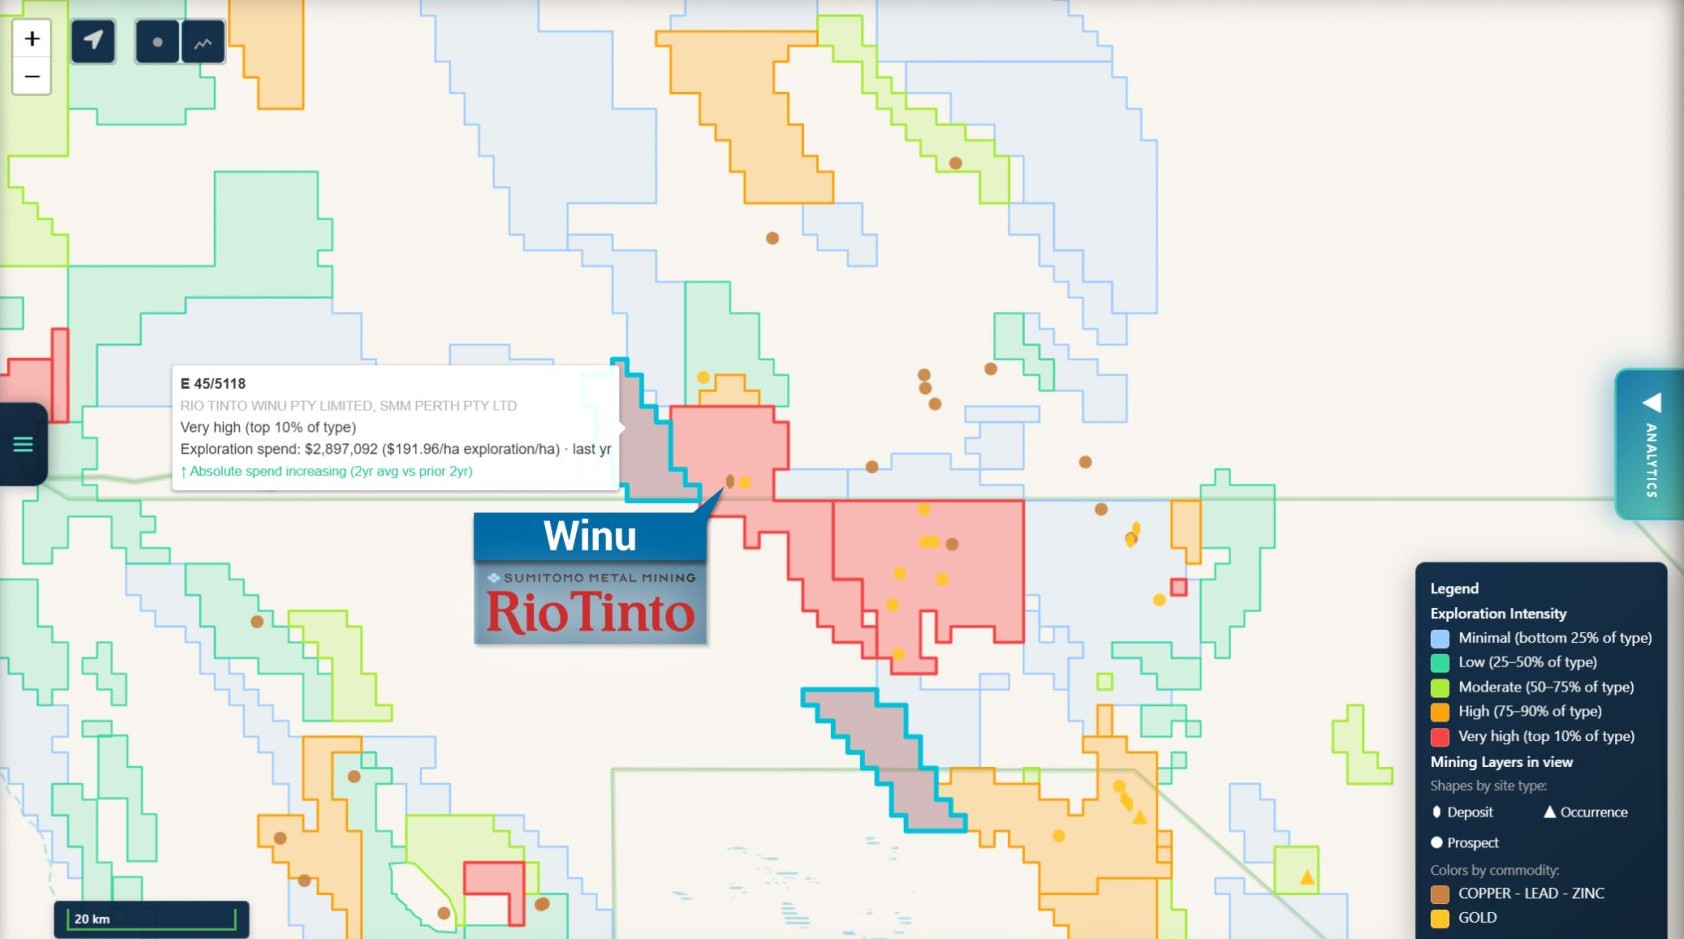
The Exploration Intensity layer instead ranks tenements by exploration spend per hectare within their tenure type, which immediately changes what becomes visible.
One example that stood out was Rio Tinto ground adjacent to the Winu copper discovery.
Following the Sumitomo JV transaction, exploration intensity on nearby tenure increased sharply relative to prior years, placing the tenement into the top percentile of comparable ground.
That kind of shift matters.
Not because it guarantees discovery, but because behavioural changes often precede announcements. Exploration programs rarely expand aggressively without a reason.
The layer is designed to surface exactly those shifts in intent.
Sometimes the Most Interesting Ground Is the Ground Nobody Is Touching
The Opportunity Signal layer approaches the problem from the opposite direction.
Instead of asking:
“Who’s spending aggressively?”
It asks:
“Who has stopped?”
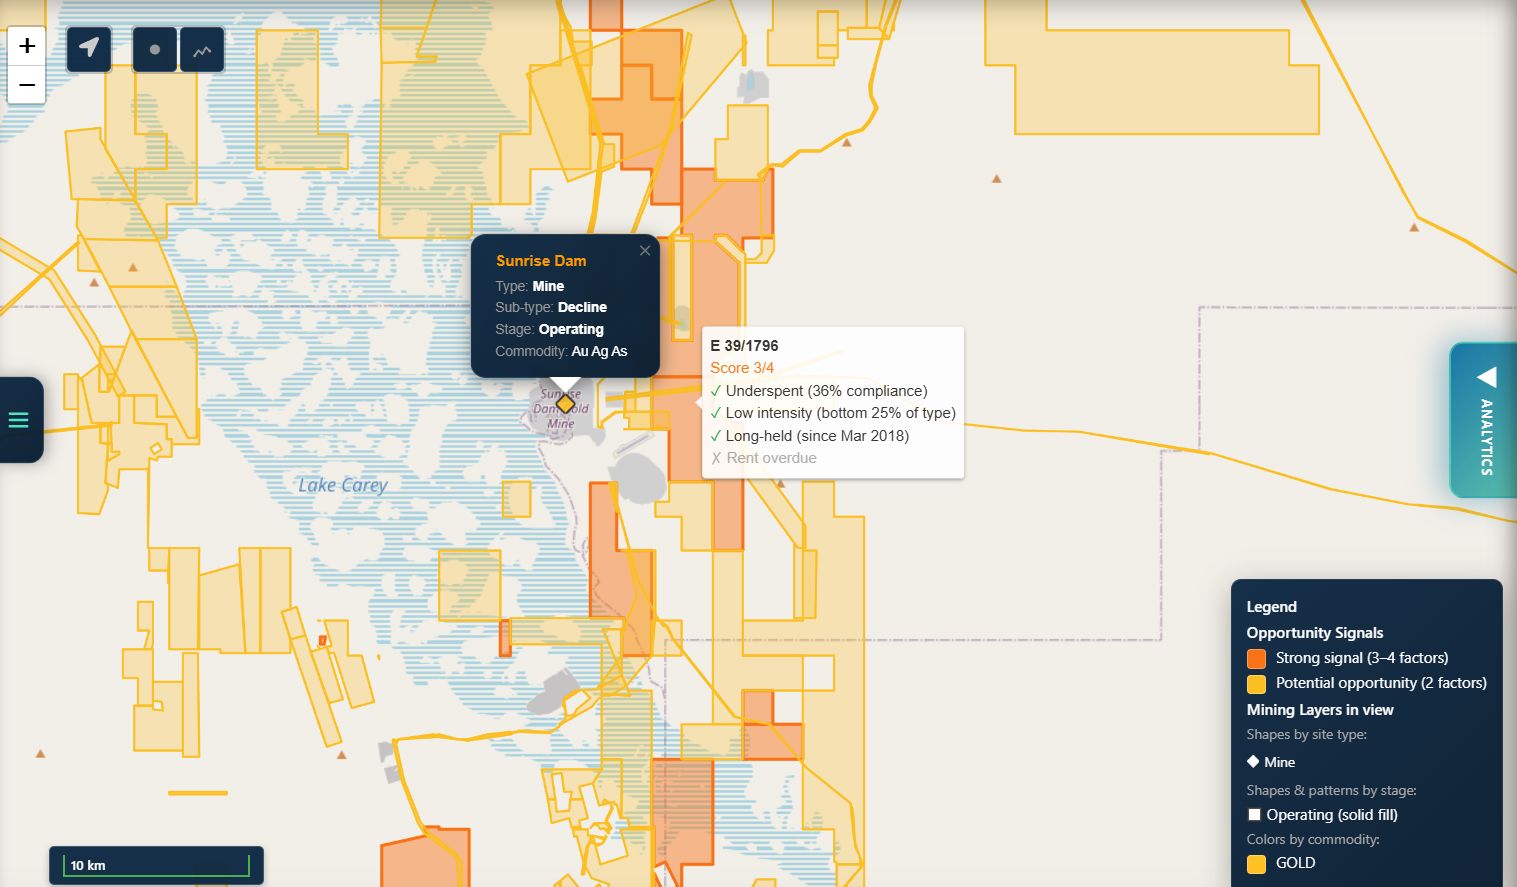
The model looks for combinations of:
- Weak expenditure compliance
- Low exploration intensity
- Long hold duration
- Rent issues
Individually those signals mean very little.
Together, they often highlight tenure that has become strategically stale:
projects sitting dormant inside major belts, long-held landbanks receiving minimal attention, or ground that may quietly become available through JV, sale or lapse.
Around Sunrise Dam, for example, there are broad areas of tenure inside a proven gold district that exhibit exactly this pattern.
Fatigue and opportunity are often the same thing viewed from different perspectives.
Heritage Spend Can Quietly Predict Drilling
One of the more interesting patterns to emerge from the expenditure data was the relationship between heritage survey activity and subsequent drilling.
In WA, Aboriginal heritage work is often one of the final stages before ground disturbance approvals are secured.
That means expenditure profiles sometimes reveal drilling intent months before rigs mobilise.
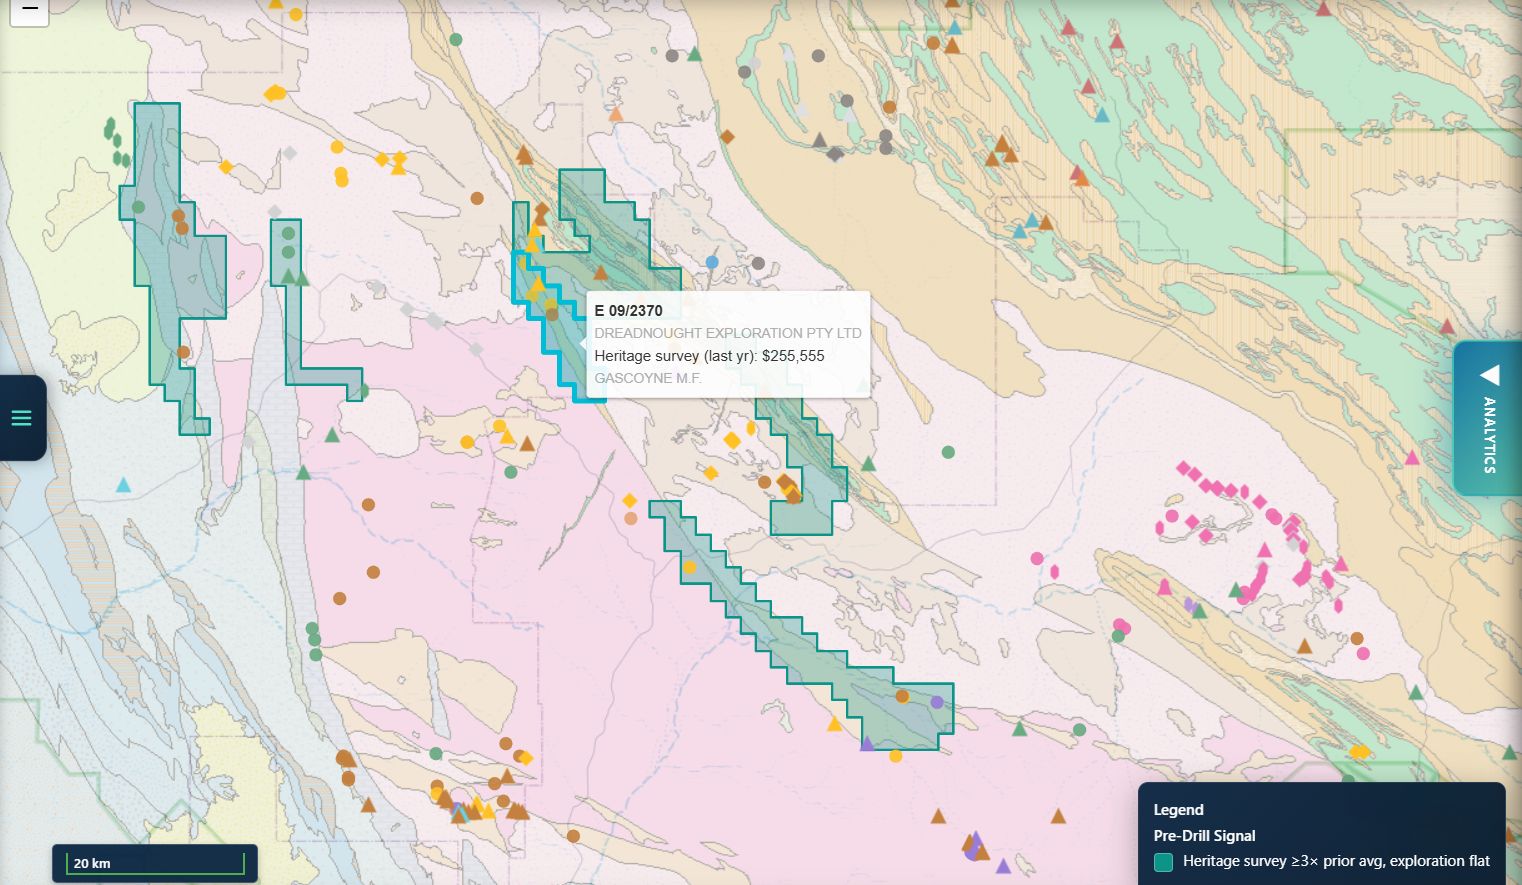
The Pre-Drill Signal layer looks specifically for exploration licences where heritage survey expenditure spikes sharply while broader exploration spend remains relatively flat.
A strong retrospective example came from Dreadnought Resources’ Mangaroon project.
Before significant drilling results along the Minga Bar shear zone were announced, expenditure had already shifted heavily toward heritage survey activity, effectively signalling that access preparation was underway.
The timeline looked like this:
heritage access work → mobilisation lag → drilling → results.
Not every heritage spike converts into discovery.
But the lead indicators are often sitting in the register long before the market focuses on the project.
Ownership History Tells a Bigger Story Than Most People Realise
A tenement boundary tells you what ground a company holds.
The ownership trail tells you what they’re actually doing with it.
Several new layers now track:
- Recently transferred tenure
- Ownership age
- Active mortgages and caveats
Viewed spatially, these patterns become surprisingly informative.
Quiet portfolio reshuffles become visible. Strategic consolidation starts standing out. Long-held dormant positions become obvious. Financing structures and encumbered projects emerge geographically instead of remaining hidden in register entries.

Examples range from Rio Tinto tenure transfers into Greatland structures to Agnew Gold Minings long held dominant tenement position near Leinster.
Previously, understanding this context required manually digging through register records one-by-one.
Now it can be assessed spatially across the entire state.

Competition Leaves Spatial Signals Too
One company pegging ground is normal.
Several companies pegging the same area simultaneously is where things become genuinely interesting.
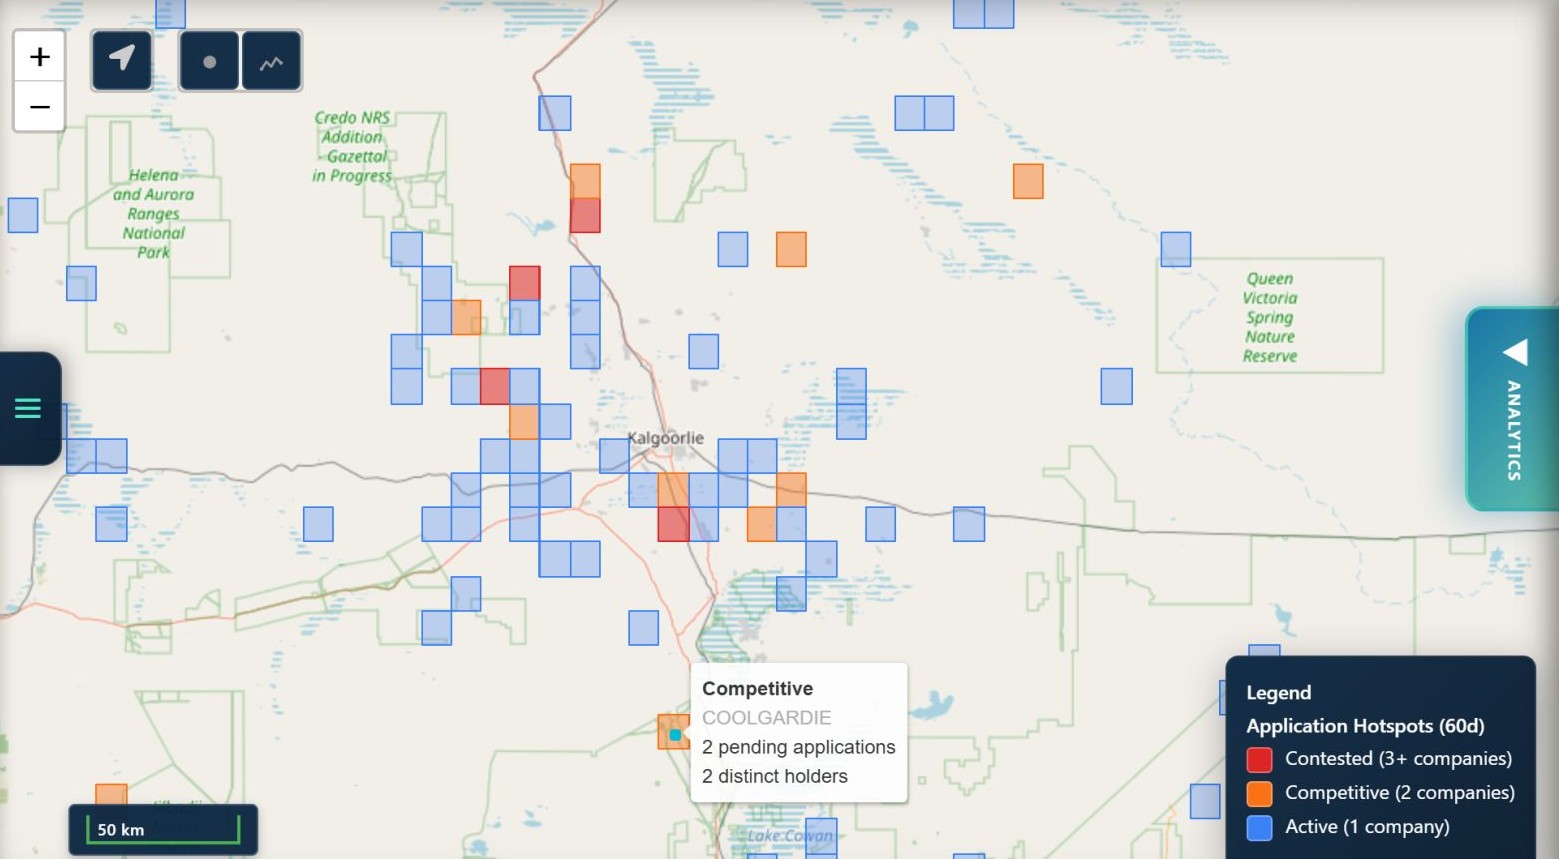
The Application Hotspots layer aggregates pending applications into district-scale grid cells and highlights where multiple distinct applicants are competing inside the same area.
The result is effectively a live heatmap of exploration attention across WA.
What starts becoming visible is not just activity, but behavioural clustering:
- Early-stage rushes
- Emerging geological concepts
- Discovery follow-on behaviour
- Quiet staking wars
Combined with standard start-date filtering, the layer allows rapid movement from district-scale competition patterns down to the individual applications themselves.
No Tengraph trawling or manual GIS setup required.
Ground Release Happens in Waves, Not Individual Tenements
Another thing that becomes obvious once registry activity is mapped spatially is that tenure release rarely occurs randomly.
It clusters.
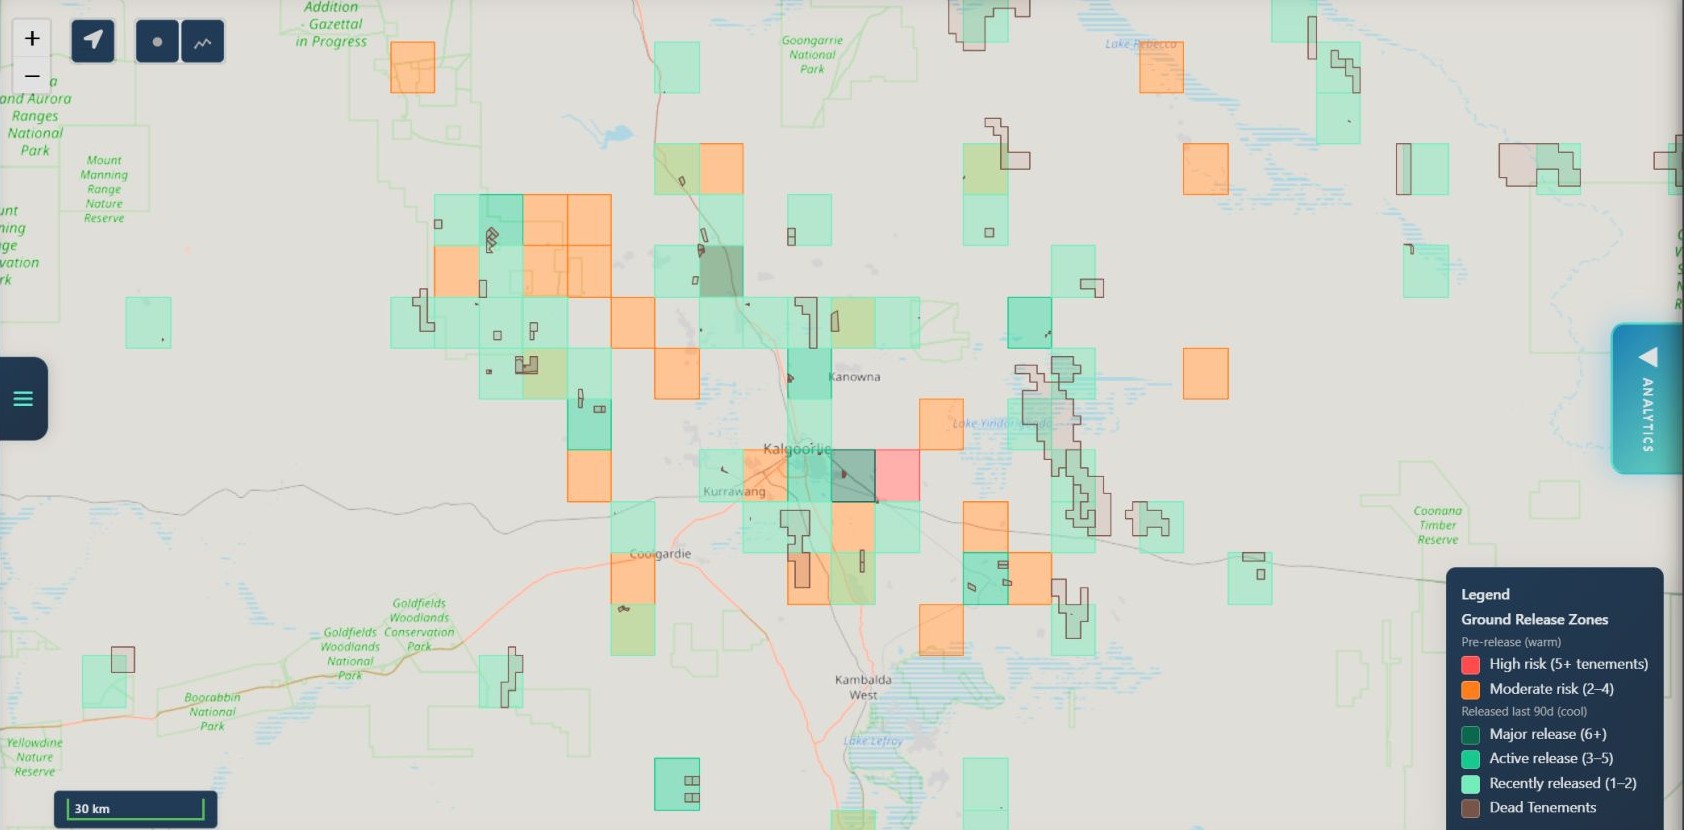
The Ground Release Zones layer aggregates expiring and recently released ground into district-scale cells, highlighting where supply is beginning to enter the market.
Some cells represent imminent risk:
tenure approaching expiry with no renewal lodged.
Others represent recently released ground:
surrenders, expiries and reopened areas.
Importantly, there is usually a lag between surrender and formal gazettal, meaning areas showing elevated “pre-release” risk may already contain effectively exiting ground before it becomes obvious publicly.
Viewed spatially, broader patterns begin emerging:
- Companies retreating from districts
- Failed exploration concepts unwinding
- Fresh opportunity windows opening
- Turnover around active discoveries
Instead of monitoring isolated tenements manually, you can now observe the release cycle at district scale.
The Registry Has Always Contained Signals. NextMaps Is About Making Them Visible.
The broader goal here is not simply to display more data.
It’s to transform static registry information into a behavioural intelligence system for WA exploration.
Most platforms stop at showing boundaries.
These layers aim to show intent, pressure, competition, fatigue, momentum and opportunity, all spatially, and often before those trends become obvious publicly.
Every layer discussed above is now live inside NextMaps.
Still free to use.
Track WA tenements and find ground to peg, sell or buy
NextMaps gives exploration companies and investors instant visibility over the full WA tenement landscape.
Get started →