
The Kimberley ground I walked away from
Like most geos, I have looked at enough ground get pegged and vended to eventually think: surely I can have a crack at that. So I did.
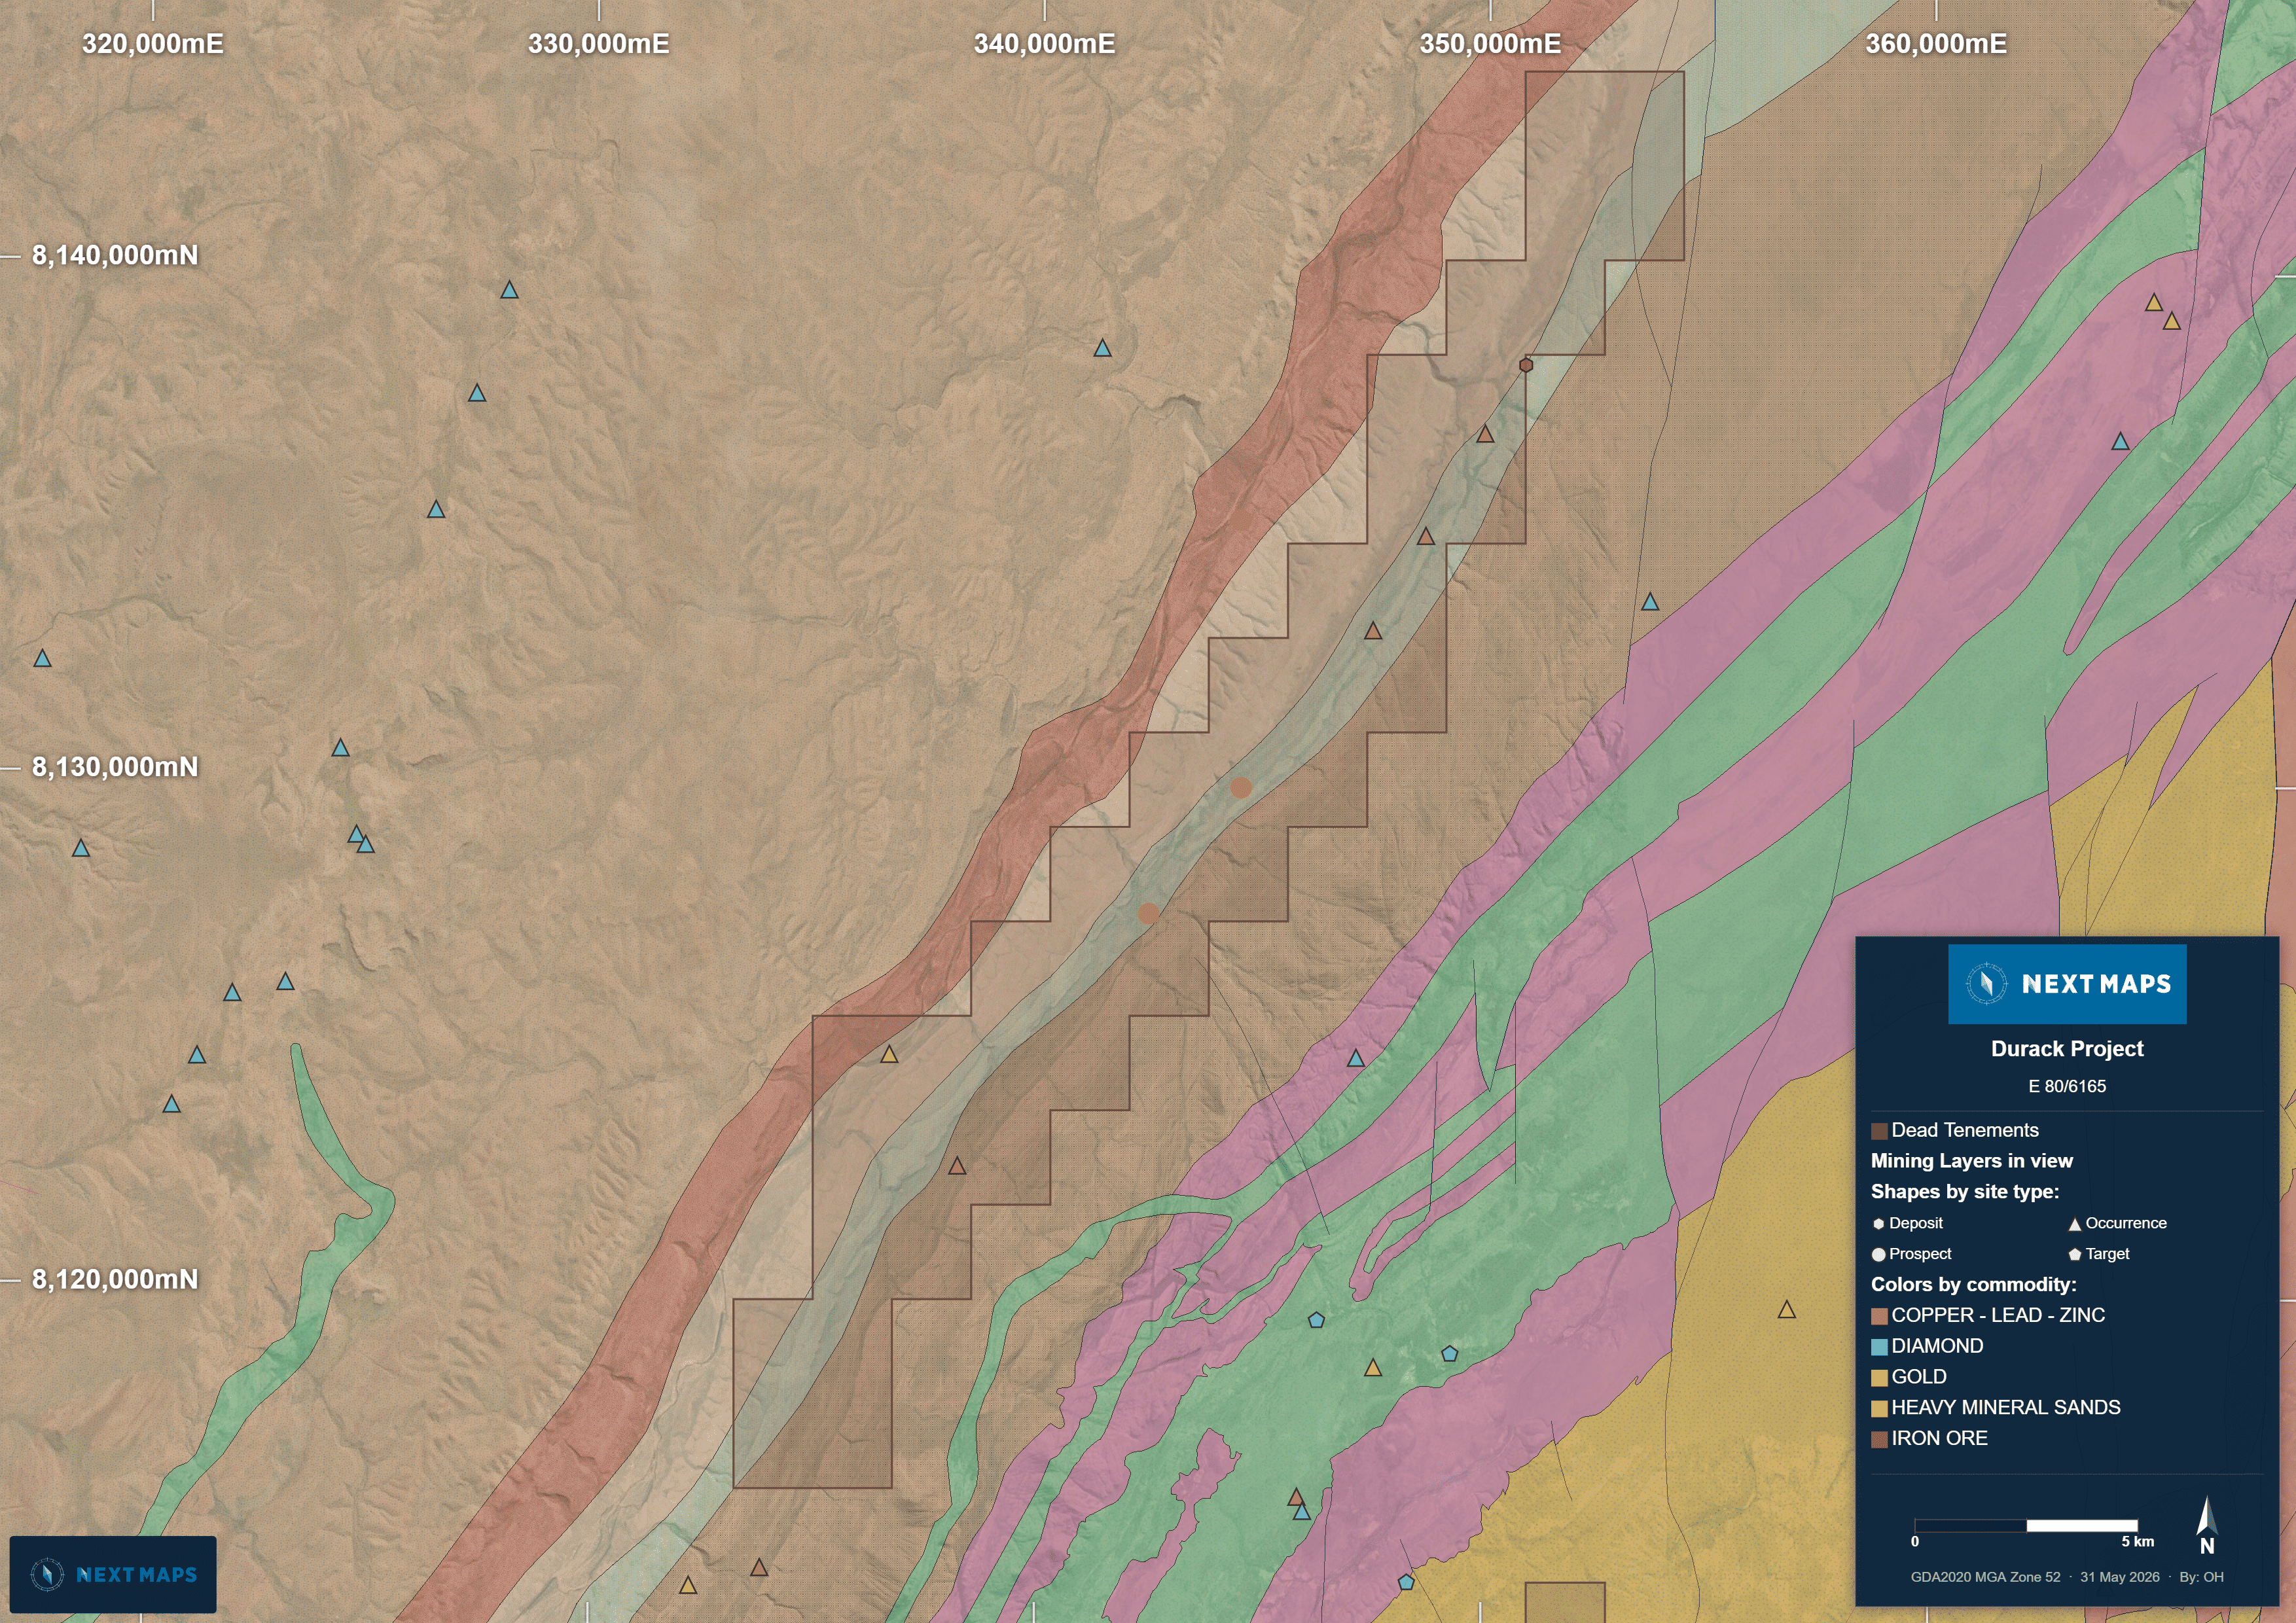
A junior explorer had optioned ground along strike in both directions and left a gap right in the middle. The target running through it was a multi-kilometre heavy-mineral band with some encouraging TREO numbers. The plan was about as simple as it gets: peg the gap, build a story, flip the ground.
I pegged it. Then I started doing the work, and the work is where these things either hold together or fall apart.
Lesson one: verify the source data
Early on it looked better than I had any right to expect. While digging through WAMEX and surface geochem I came across multiple gold values up to 20 ppm Au. That is the kind of number that makes you sit up.
Then I noticed the A-file author was an old boss of mine from a previous job. I gave him a call.
"Yeah, those are probably ppb, not ppm."
I went back to the original ASX release. Parts per billion. It was a unit slip that had been carried forward and was sitting in the historical record waiting for someone to take it at face value.
The lesson is old and boring and true: verify the source data, every time, especially when it is telling you what you want to hear.
Lesson two: geometry and mining reality kill most ideas
So, back to the heavy-mineral band. On paper it was excellent. Continuous over kilometres, ore-grade TREO values. The kind of strike length that reads like a real deposit.
The problem was the third dimension.
The band is roughly 30 to 60 cm thick, dipping at about 10 degrees. To build even a modest resource out of a layer that thin, you are mining a shallow-dipping sheet across the whole landscape. In rough numbers that is a pit on the order of 10 km long and a kilometre wide, chasing a half-metre seam the entire way. The grade was fine. The geometry was not, and the geometry does not care how good the grade is.
There was no real buyer interest, the economics were impossible, and there were better uses of my time. So I dropped the ground and moved on. For anyone wondering, it is still open.
The part that actually bothered me
The decision was straightforward once I had the full picture. Getting the full picture was not.
The process took ages. Manually pulling WAMEX reports one A-file at a time. Cross-checking geochem across decades of inconsistent reporting. Rebuilding the tenure history. Trying to sanity-check a concept that, it turned out, geometry was always going to sink. By the time I had assembled enough to make the call, I had spent days assembling data, not days thinking about the deposit.
That gap, between having access to the data and having an answer, is exactly the problem I built NextMaps to solve.
Going back with the reports
We have since released AI Prospectivity Reports. They read the historical record for an area and synthesise the exploration history, the mineralisation evidence, the geochemistry and the geological setting into a commodity-specific assessment.
I ran the same old project back through them, partly as a test. If the reports are any good, they should get me to the same place I reached manually, in a fraction of the time. So I ran it twice, once as heavy-mineral sands and once as rare earths, because the band could reasonably be read either way and I wanted to see how each lens handled it.
HMS mode -> Report Here
First the heavy-mineral-sands read, since it is a heavy-mineral horizon.
Credit where it is due. The report correctly recognised the band as a lithified seam rather than lumping it in with the alluvial titanomagnetite sands that also turn up in the district. That distinction matters, because it changes the entire mining concept: you are crushing rock to liberate the heavy minerals, not dredging or dry-mining loose sand. It made the obvious call that this is not a conventional mineral-sands play, and then made the more useful one: the real value sits in the contained monazite, and rare earths deserved their own assessment.
So I ran that mode too.
REE mode -> Report Here
The rare-earth report was the more interesting read, because it disagreed with me.
It rated the ground moderate and worth a follow-up. It confirmed monazite and florencite in the heavy-mineral concentrations, flagged the thorium penalty carried by the monazite, but also picked up yttrium running to a few thousand ppm, which points at heavy rare earths sitting alongside the light. On the chemistry alone, that is a go-and-sample call. The report's recommended next steps were a proper sampling and concentrate-assay programme, not a dismissal.
And that is the point worth dwelling on.
The report was right. The rare-earth story in that ground is real, and, in the histroical reports, it has never been directly assayed; every grade in the historical record is a thorium or uranium proxy, not an actual REE number. On the merits of the mineralisation, "go and sample it" is the correct conclusion.
I still walked away, because the geometry makes it uneconomic no matter what the assays come back at. A commodity assessment tells you whether the mineralisation is there. It does not tell you whether you can mine it. Those are two different questions, and only one of them was ever going to be answered by reading the rock.
What I actually take from this
Neither report made the decision for me. What they did was cover, in minutes, most of the ground that took me days: the deposit style, the commodity case under two different lenses, and the line between an interesting rock and a viable project. The geometry call, the thing that actually killed it, was still mine to make. That is the right division of labour. The tool should compress the data gathering and the first-pass synthesis; the judgement stays with the geologist.
It is also worth being clear about what sits underneath the report. Each one comes out of a datapack that compiles every historical A-file in the area into a single download, and rolls the historical data into one dataroom: surface geochem, downhole assays and geology logging, in one compiled set rather than 50-odd separate WAMEX pulls. Many of those manual hours I spent on this project were exactly that work. The gold-versus-ppb mix-up is the cautionary note here too: the datapack surfaces the anomaly, but verifying it is still on you. Faster access to the data does not remove the obligation to check it.
Explorers are not short on data. They are short on time. These reports will not hand you the next Tier 1 deposit, and they are not meant to. They answer a simpler, more common, more valuable question, and they answer it fast: is this worth more of your time?
For this piece of Kimberley ground, the honest answer was no. It took me days to be sure of that the first time. It would take a lot less now.
Every NextMaps account includes a couple of free reports. If you have a project, prospect, or patch of ground you want to sanity-check, you can run one at nextmaps.com.au.
Track WA tenements and find ground to peg, sell or buy
NextMaps gives exploration companies and investors instant visibility over the full WA tenement landscape.
Get started →