
Hyperspectral mineral maps across Western Australia
A new remote-sensing layer in NextMaps: EnMAP hyperspectral mineral maps, our own derived products from 224-band satellite data. Where ASTER sees a broad mineral group, hyperspectral resolves the species and its chemistry, so white-mica chemistry, kaolin crystallinity and chlorite Fe/Mg become alteration vectors. Now tiled over the whole state, straight on the WA tenement map.
ASTER will tell you there is AlOH clay on a hillside. What it will not tell you is whether that clay is muscovite or phengite, whether the kaolinite is well ordered or not, or which way the chemistry is trending. Often that is exactly what you want to know, because the species and its chemistry are the vector, not just the presence of a mineral group.
Getting that from a satellite used to mean doing the hard part yourself: find a hyperspectral scene, download the cube, run continuum removal, measure the band depths, fit the feature positions, and do it again for the next scene. So we built it into NextMaps. A new layer, EnMAP hyperspectral mineral maps, sitting right on top of the WA tenement map, and now tiled across the whole state.
Mineral species, not just groups
EnMAP reads 224 contiguous spectral bands across the visible, near and shortwave infrared. ASTER has a handful. That extra spectral detail is the difference between "there is clay here" and reading the actual mineralogy and its chemistry. We process the raw cubes into our own mineral-index and principal-component products and serve them as ready-to-use map layers, so there is nothing to download or compute:
- White mica abundance and composition: sericite intensity from the 2200 nm feature, plus the exact wavelength position that tracks phengite to muscovite chemistry, a vector toward fluid source and temperature
- Kaolin crystallinity: the 2160 and 2200 nm doublet, separating well-ordered kaolinite for advanced argillic alteration and lithocaps
- Ferric oxide and Fe-OH gossan: hematite and goethite abundance, and jarosite-style Fe-OH for acid-sulphate ground and gossan caps
- Chlorite, MgOH and chlorite composition: propylitic alteration and mafic rocks, plus the Fe/Mg trend that vectors in some VMS and porphyry systems
- Mineral-index RGB and a PCA composite: fast, species-level composites for reading lithology and structure at a glance
Every layer has its own opacity slider, so you can fade it in underneath your tenure, geology and geophysics.
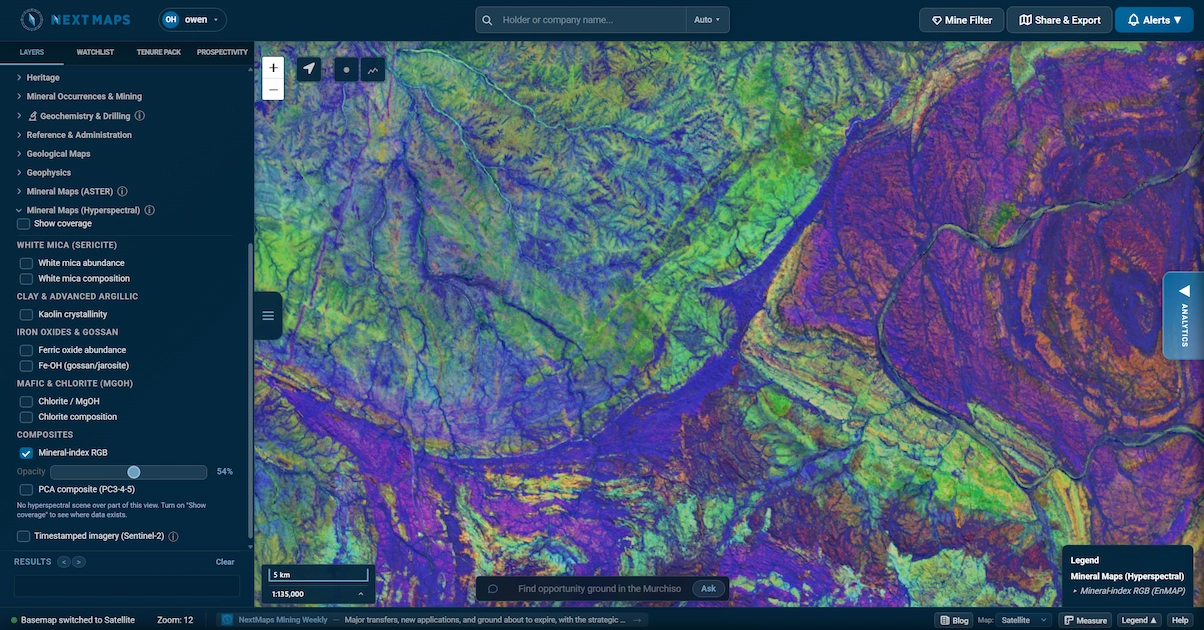 An EnMAP hyperspectral mineral map over WA tenure, one of nine species-level products.
Now across the whole state
We processed close to two thousand EnMAP scenes covering Western Australia, all graded identically, so a colour means the same mineral intensity whether you are in the Pilbara, the Murchison or the Goldfields. That statewide consistency is the point: you can compare one belt against another directly.
Satellite hyperspectral is tasked, not wall-to-wall, so coverage is a patchwork of acquisitions rather than a seamless basemap. We are honest about that. Turn on Show coverage, which is free for everyone, to see exactly where scenes exist before you lean on them, and expect to keep seeing coverage densify as we infill.
It complements ASTER, it does not replace it
Use them together. Regional ASTER to sweep a district and to map silica, which needs thermal infrared that hyperspectral does not carry. EnMAP to resolve the actual species and chemistry once you have narrowed it down. Then timestamped Sentinel-2 to zoom in on the exact block and keep an eye on activity. From there, a Prospectivity Data Room reads the WAMEX history behind whatever ground you have flagged.
As with every spectral layer in NextMaps, these are pathfinders, not truth. A band-depth index flags a spectral response, not a confirmed mineral occurrence, and vegetation and water are masked out so they cannot masquerade as signal. They point you at the ground worth a closer look. The call stays with you.
The coverage outline is free to browse, and the mineral products themselves are part of Premium. They are built on open EnMAP data, and carry the required attribution: contains modified EnMAP data, copyright DLR. Open the map and see what your ground is telling you.
Track WA tenements and find ground to peg, sell or buy
NextMaps gives exploration companies and investors instant visibility over the full WA tenement landscape.
Get started →